

May 2026: 1.78% (A+ grade)
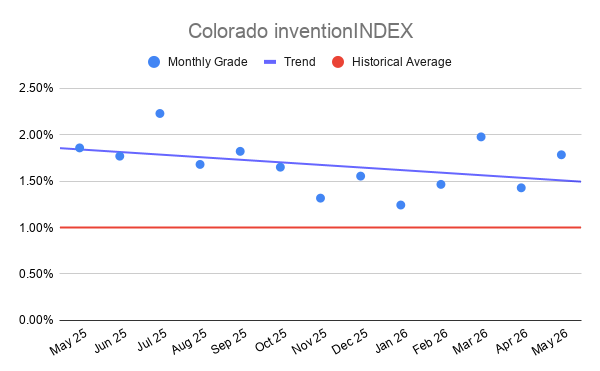
Colorado inventionINDEX May 2026: 1.78% (A+ grade)
The inventionINDEX measures innovation output by comparing GDP growth with patent production growth.
Anything over C grade is positive sentiment; anything under C is negative outlook/sentiment. Using that sentiment, it is possible to observe trends over time, and also compare states/countries. In doing so, we can predict which states have the best chance to recover economically from the pandemic (or any other economic incident that may occur).
Colorado inventionINDEX Scores – Last 12 months
| Month | inventionINDEX Score |
| May 2026 | 1.78% |
| Apr 26 | 1.43% |
| Mar 26 | 1.98% |
| Feb 26 | 1.46% |
| Jan 26 | 1.24% |
| Dec 25 | 1.55% |
| Nov 25 | 1.32% |
| Oct 25 | 1.65% |
| Sep 25 | 1.82% |
| Aug 25 | 1.68% |
| Jul 25 | 2.23% |
| Jun 25 | 1.77% |
| May 25 | 1.86% |
The Colorado inventionINDEX for May 2026 stands at 1.78%, achieving a top-tier A+ rating and demonstrating a resilient return to form. This current score represents a notable improvement over the historical 60-month baseline, outpacing both the long-term average of 1.71% and the median of 1.75%. The May 2026 figure marks a vital rebound from a volatile start to the year, which saw the index plummet to a low of 1.24% (B-) in January and struggle at 1.46% (B+) in February. By rising above the historical average, the current index confirms that the regional innovation ecosystem is operating at an elevated capacity compared to its historical performance over the last five years.
Examining the broader historical trajectory reveals that the index has experienced distinct cycles of expansion and contraction since mid-2021. The index reached its absolute peak in October 2023 at an impressive 2.44%, culminating a period of high innovation density where the yearly average for both 2023 and 2024 hovered above 1.80%. In contrast, the lowest point in the 60-month dataset occurred in December 2021, when the index bottomed out at 1.21% with a B- rating. The historical frequency of the ratings further underscores the consistency of the current standing; while the A+ rating is the most frequent grade across the 61 recorded months, representing 33 occurrences, the frequent fluctuations between the A and B categories highlight the competitive and sensitive nature of the underlying indicators.
Achieving a higher grade, such as the current A+ rating, yields substantial positive outcomes for the regional economy and its stakeholders. An elevated inventionINDEX score signals a highly active intellectual property landscape, characterized by robust patent filings, heightened research and development investments, and a strong collaborative network between academia and industry. These conditions foster an environment that naturally attracts venture capital and angel investors looking for fertile ground to fund high-growth startups. Furthermore, a consistently high score enhances Colorado’s reputation as a premier technological and creative hub, helping local enterprises recruit top-tier talent from across the country and driving high-wage job creation.
Conversely, the negative implications of a lower score or a sustained downward trend pose significant risks to the state’s economic vitality. When the index drops to levels seen in January 2026 or December 2021, it typically reflects a contraction in commercial creativity, capital constraints, or a cautious shift in corporate risk tolerance. Persistent lower scores can indicate that local innovators are struggling to secure funding, navigate regulatory hurdles, or bring new concepts to market. Over time, these periods of stagnation can lead to a loss of regional competitiveness, as talent and capital migrate toward more dynamic tech ecosystems, ultimately slowing down long-term productivity growth and economic diversification.
Discussion:
In May, the Colorado inventionINDEX scored a positive sentiment which was higher than the previous year’s average and outperformed the downward trend for the year. This is similar to the prior 12 months, which experienced a slight downward trend.
As the economy continues to stabilize in the post-pandemic era, it remains uncertain whether any backlog of applications still exists or if the department has returned to normal processing timelines. The inventionINDEX could also be affected by lingering consequences from the pandemic, such as company closures, reduced workforces, and limited R&D capabilities, which may still be impacting current operations.
Learn More:
Are you thinking of patenting any of your bright ideas? Did you know your research work could be eligible for the R&D Tax Credit and you can receive up to 14% back on your expenses? To find out more, please check out our free online eligibility test.
Swanson Reed’s Colorado office provides R&D tax credit consulting and advisory services to Denver, Colorado Springs, Aurora, Fort Collins, Lakewood, Thornton, Arvada, Westminster, Pueblo and Centennial.
Feel free to book a quick teleconference with one of R&D tax specialists if you would like to learn more about R&D tax credit opportunities.
Who We Are:
Swanson Reed is the largest Specialist R&D tax credit advisory firm in the United States. With offices nationwide, we are one of the only firms globally to exclusively provide R&D tax credit consulting services to our clients. We have been exclusively providing R&D tax credit claim preparation and audit compliance solutions for over 30 years.
Swanson Reed hosts daily free webinars and provides free IRS CE and CPE credits for CPAs. For more information please visit us at www.swansonreed.com/free-webinars or contact your usual Swanson Reed representative.
Are you eligible?

Why choose us?

Pass an Audit?

What is the R&D Tax Credit?
The Research & Experimentation Tax Credit (or R&D Tax Credit), is a general business tax credit under Internal Revenue Code section 41 for companies that incur research and development (R&D) costs in the United States. The credits are a tax incentive for performing qualified research in the United States, resulting in a credit to a tax return. For the first three years of R&D claims, 6% of the total qualified research expenses (QRE) form the gross credit. In the 4th year of claims and beyond, a base amount is calculated, and an adjusted expense line is multiplied times 14%. Click here to learn more.
Never miss a deadline again

Stay up to date on IRS processes

Discover R&D in your industry

R&D Tax Credit Preparation Services
Swanson Reed is one of the only companies in the United States to exclusively focus on R&D tax credit preparation. Swanson Reed provides state and federal R&D tax credit preparation and audit services to all 50 states.
If you have any questions or need further assistance, please call or email our CEO, Damian Smyth on (800) 986-4725.
Feel free to book a quick teleconference with one of our national R&D tax credit specialists at a time that is convenient for you.
R&D Tax Credit Audit Advisory Services
creditARMOR is a sophisticated R&D tax credit insurance and AI-driven risk management platform. It mitigates audit exposure by covering defense expenses, including CPA, tax attorney, and specialist consultant fees—delivering robust, compliant support for R&D credit claims. Click here for more information about R&D tax credit management and implementation.
Our Fees
Swanson Reed offers R&D tax credit preparation and audit services at our hourly rates of between $195 – $395 per hour. We are also able offer fixed fees and success fees in special circumstances. Learn more at https://www.swansonreed.com/about-us/research-tax-credit-consulting/our-fees/


Choose your state


