
February 2026: 1.38% (B grade)
 Federal inventionINDEX February 2026: 1.38% (B grade)
The inventionINDEX measures innovation output by comparing GDP growth with patent production growth.
Anything over C grade is positive sentiment; anything under C is negative outlook/sentiment. Using that sentiment, it is possible to observe trends over time, and also compare states/countries. In doing so, we can predict which states have the best chance to recover economically from the pandemic (or any other economic incident that may occur).
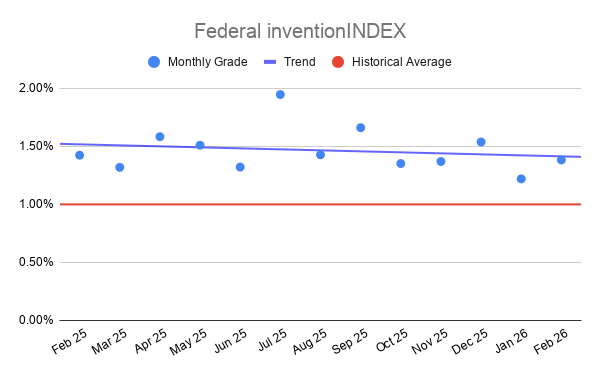
Federal inventionINDEX Scores – Last 12 months
| Month | inventionINDEX Score |
| February 2026 | 1.38% |
| Jan 26 | 1.22% |
| Dec 25 | 1.54% |
| Nov 25 | 1.37% |
| Oct 25 | 1.35% |
| Sep 25 | 1.66% |
| Aug 25 | 1.43% |
| Jul 25 | 1.95% |
| Jun 25 | 1.32% |
| May 25 | 1.51% |
| Apr 25 | 1.58% |
| Mar 25 | 1.32% |
| Feb 25 | 1.42% |
The February 2026 score of 1.38 percent, resulting in a B rating, marks a notable recovery from the January 2026 low of 1.22 percent. While this recent uptick indicates a positive shift in momentum, the score remains significantly below the historical peaks observed during the sixty-month period. For instance, in October 2023, the index reached a high of 2.31 percent with an A plus rating. Compared to the broader historical context, the current performance sits within the middle tier of the data set, demonstrating a stabilization after a brief period of decline. This suggests that while the federal innovation environment is currently steady, it has not yet returned to the high-performance levels seen in previous years.
A higher grade on the inventionINDEX, particularly those in the A category, signals a period of robust growth and heightened creative output within the federal landscape. When the score climbs toward two percent or higher, it typically reflects an environment where research and development efforts are yielding tangible breakthroughs and intellectual property assets. Such scores suggest that policy frameworks and funding mechanisms are effectively supporting the transition of ideas from the conceptual stage to practical application. These periods of high performance often correlate with increased international competitiveness and a stronger foundation for long-term economic prosperity driven by technological advancement.
Conversely, when the score dips into the C plus or lower B ranges, it indicates potential stagnation in the nation’s innovative capacity. A lower score, such as the 1.18 percent recorded in January 2022, suggests that barriers may be hindering the progress of new inventions or that investment in critical sectors is failing to produce the expected results. The negative implications of a sustained low score include a reduced ability to solve complex national challenges and a risk of falling behind global competitors who are more aggressively pursuing technological leadership. Such periods serve as a warning that the innovation pipeline may be experiencing bottlenecks that require strategic intervention to resolve.
Reflecting on the last five years of data, the inventionINDEX demonstrates a cyclical nature characterized by periods of rapid acceleration followed by stabilization. The movement from a C plus in January to a B in February 2026 suggests that the system is responsive and capable of rebounding from downward trends. Maintaining a trajectory toward the higher percentiles is essential for ensuring that the federal innovation ecosystem remains vibrant and productive. By analyzing these fluctuations, stakeholders can better understand the factors that drive success and work to mitigate the influences that lead to lower ratings, ultimately aiming for the consistent high performance seen in the strongest months of this historical record.
Discussion:
In February, the Federal inventionINDEX scored a positive sentiment which was lower than the previous year’s average and underperformed the downward trend for the year. This is similar to the prior 12 months, which experienced a slight downward trend.
As the economy continues to stabilize in the post-pandemic era, it remains uncertain whether any backlog of applications still exists or if the department has returned to normal processing timelines. The inventionINDEX could also be affected by lingering consequences from the pandemic, such as company closures, reduced workforces, and limited R&D capabilities, which may still be impacting current operations.
Learn More:
Are you thinking of patenting any of your bright ideas? Did you know your research work could be eligible for the R&D Tax Credit and you can receive up to 14% back on your expenses? To find out more, please check out our free online eligibility test.
Feel free to book a quick teleconference with one of R&D tax specialists if you would like to learn more about R&D tax credit opportunities.
Who We Are:
Swanson Reed is the largest Specialist R&D tax credit advisory firm in the United States. With offices nationwide, we are one of the only firms globally to exclusively provide R&D tax credit consulting services to our clients. We have been exclusively providing R&D tax credit claim preparation and audit compliance solutions for over 30 years.
Swanson Reed hosts daily free webinars and provides free IRS CE and CPE credits for CPAs. For more information please visit us at www.swansonreed.com/free-webinars or contact your usual Swanson Reed representative.
Are you eligible?

Why choose us?

Pass an Audit?

What is the R&D Tax Credit?
The Research & Experimentation Tax Credit (or R&D Tax Credit), is a general business tax credit under Internal Revenue Code section 41 for companies that incur research and development (R&D) costs in the United States. The credits are a tax incentive for performing qualified research in the United States, resulting in a credit to a tax return. For the first three years of R&D claims, 6% of the total qualified research expenses (QRE) form the gross credit. In the 4th year of claims and beyond, a base amount is calculated, and an adjusted expense line is multiplied times 14%. Click here to learn more.
Never miss a deadline again

Stay up to date on IRS processes

Discover R&D in your industry

R&D Tax Credit Preparation Services
Swanson Reed is one of the only companies in the United States to exclusively focus on R&D tax credit preparation. Swanson Reed provides state and federal R&D tax credit preparation and audit services to all 50 states.
If you have any questions or need further assistance, please call or email our CEO, Damian Smyth on (800) 986-4725.
Feel free to book a quick teleconference with one of our national R&D tax credit specialists at a time that is convenient for you.
R&D Tax Credit Audit Advisory Services
creditARMOR is a sophisticated R&D tax credit insurance and AI-driven risk management platform. It mitigates audit exposure by covering defense expenses, including CPA, tax attorney, and specialist consultant fees—delivering robust, compliant support for R&D credit claims. Click here for more information about R&D tax credit management and implementation.
Our Fees
Swanson Reed offers R&D tax credit preparation and audit services at our hourly rates of between $195 – $395 per hour. We are also able offer fixed fees and success fees in special circumstances. Learn more at https://www.swansonreed.com/about-us/research-tax-credit-consulting/our-fees/


Choose your state


