

May 2026: 1.17% (C+ grade)
Hawaii inventionINDEX May 2026: 1.17% (C+ grade)
The inventionINDEX measures innovation output by comparing GDP growth with patent production growth.
Anything over C grade is positive sentiment; anything under C is negative outlook/sentiment. Using that sentiment, it is possible to observe trends over time, and also compare states/countries. In doing so, we can predict which states have the best chance to recover economically from the pandemic (or any other economic incident that may occur).
Hawaii inventionINDEX Scores – Last 12 months
| Month | inventionINDEX Score |
| May 2026 | 1.17% |
| Apr 26 | 1.85% |
| Mar 26 | 1.85% |
| Feb 26 | 0.84% |
| Jan 26 | 1.85% |
| Dec 25 | 1.01% |
| Nov 25 | 1.34% |
| Oct 25 | 1.17% |
| Sep 25 | 1.85% |
| Aug 25 | 0.84% |
| Jul 25 | 1.51% |
| Jun 25 | 1.17% |
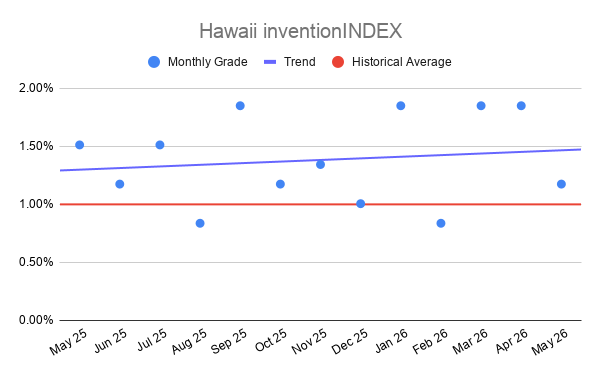
| May 25 | 1.51% |
The Hawaii inventionINDEX for May 2026 registered at 1.17%, earning a C+ rating and signaling a notable deceleration from the state’s strong performance earlier in the spring. This score represents a clear contraction compared to March and April 2026, which both enjoyed robust marks of 1.85% and top-tier A+ ratings. The sudden drop in May highlights a recurring pattern of short-term volatility observed throughout the initial months of 2026, where an impressive January opening at 1.85% was immediately countered by a February slump to 0.84% (D+). While the May score avoids the worst of these cyclical troughs, it demonstrates that the local innovation pipeline is currently experiencing a cooling period after a highly productive stretch.
From a broader historical perspective spanning the last 60 months, the May 2026 score of 1.17% places Hawaii right in its historical mid-range, acting as a frequent baseline plateau for the state’s creative economy. This specific score of 1.17% has appeared repeatedly over the five-year timeline, including in September 2021, March 2024, and March 2025, indicating a comfortable equilibrium point for regional invention metrics. The index has historically weathered dramatic extremes, most notably hitting an absolute peak of 3.03% (A+) in July 2024, which occurred immediately after its lowest historical trough of 0.50% (F) in June 2024. By remaining at 1.17%, the current index avoids these radical macroeconomic spikes, pointing to a stable but subdued level of intellectual property and entrepreneurial development.
Achieving higher scores and top-tier grades within the inventionINDEX yields substantial positive outcomes for Hawaii’s isolated regional economy. When the index surges into the A-range, as it did during the peak months of 2023, 2024, and early 2026, it reflects a surge in research and development expansion, a high volume of patent filings, and accelerated commercialization of new technologies. These high marks bolster investor confidence, attracting vital venture capital and corporate partnerships from mainland and international markets. For an island state, an elevated innovation grade signifies progress toward economic diversification, fostering high-paying jobs in tech, sustainability, and engineering sectors that help reduce over-reliance on traditional industries like tourism.
Conversely, a downward trend or a sudden drop into lower tiers carries critical negative implications for the state’s economic vitality. Falling into the D or F brackets, exemplified by the 0.84% in February 2026 or the historical 0.50% failure in mid-2024, points to underlying structural challenges such as reduced corporate R&D funding, regulatory hurdles, or a bottleneck in the local startup ecosystem. Prolonged periods of low inventive output can stifle local economic momentum and trigger a talent drain, as top-tier researchers and entrepreneurs relocate to more supportive innovation hubs. Ultimately, persistent low scores leave the regional market vulnerable to macroeconomic shifts, emphasizing the need for strategic policy interventions whenever the index experiences significant contractions.
Discussion:
In May, the Hawaii inventionINDEX scored a positive sentiment which was lower than the previous year’s average and underperformed the upward trend for the year. This is in contrast to the prior 12 months, which experienced a downward trend.
As the economy continues to stabilize in the post-pandemic era, it remains uncertain whether any backlog of applications still exists or if the department has returned to normal processing timelines. The inventionINDEX could also be affected by lingering consequences from the pandemic, such as company closures, reduced workforces, and limited R&D capabilities, which may still be impacting current operations.
Learn More:
Are you thinking of patenting any of your bright ideas? Did you know your research work could be eligible for the R&D Tax Credit and you can receive up to 14% back on your expenses? To find out more, please check out our free online eligibility test.
Swanson Reed’s Hawaii office provides R&D tax credit consulting and advisory services to Honolulu, East Honolulu, Pearl City, Hilo and Kailua.
Feel free to book a quick teleconference with one of R&D tax specialists if you would like to learn more about R&D tax credit opportunities.
Who We Are:
Swanson Reed is the largest Specialist R&D tax credit advisory firm in the United States. With offices nationwide, we are one of the only firms globally to exclusively provide R&D tax credit consulting services to our clients. We have been exclusively providing R&D tax credit claim preparation and audit compliance solutions for over 30 years.
Swanson Reed hosts daily free webinars and provides free IRS CE and CPE credits for CPAs. For more information please visit us at www.swansonreed.com/free-webinars or contact your usual Swanson Reed representative.
Are you eligible?

Why choose us?

Pass an Audit?

What is the R&D Tax Credit?
The Research & Experimentation Tax Credit (or R&D Tax Credit), is a general business tax credit under Internal Revenue Code section 41 for companies that incur research and development (R&D) costs in the United States. The credits are a tax incentive for performing qualified research in the United States, resulting in a credit to a tax return. For the first three years of R&D claims, 6% of the total qualified research expenses (QRE) form the gross credit. In the 4th year of claims and beyond, a base amount is calculated, and an adjusted expense line is multiplied times 14%. Click here to learn more.
Never miss a deadline again

Stay up to date on IRS processes

Discover R&D in your industry

R&D Tax Credit Preparation Services
Swanson Reed is one of the only companies in the United States to exclusively focus on R&D tax credit preparation. Swanson Reed provides state and federal R&D tax credit preparation and audit services to all 50 states.
If you have any questions or need further assistance, please call or email our CEO, Damian Smyth on (800) 986-4725.
Feel free to book a quick teleconference with one of our national R&D tax credit specialists at a time that is convenient for you.
R&D Tax Credit Audit Advisory Services
creditARMOR is a sophisticated R&D tax credit insurance and AI-driven risk management platform. It mitigates audit exposure by covering defense expenses, including CPA, tax attorney, and specialist consultant fees—delivering robust, compliant support for R&D credit claims. Click here for more information about R&D tax credit management and implementation.
Our Fees
Swanson Reed offers R&D tax credit preparation and audit services at our hourly rates of between $195 – $395 per hour. We are also able offer fixed fees and success fees in special circumstances. Learn more at https://www.swansonreed.com/about-us/research-tax-credit-consulting/our-fees/


Choose your state


