

May 2026: 0.93% (C- grade)
Illinois inventionINDEX May 2026: 0.93% (C- grade)
The inventionINDEX measures innovation output by comparing GDP growth with patent production growth.
Anything over C grade is positive sentiment; anything under C is negative outlook/sentiment. Using that sentiment, it is possible to observe trends over time, and also compare states/countries. In doing so, we can predict which states have the best chance to recover economically from the pandemic (or any other economic incident that may occur).
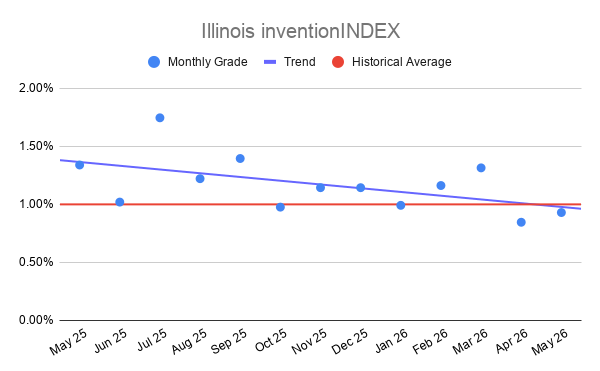
Illinois inventionINDEX Scores – Last 12 months
| Month | inventionINDEX Score |
| May 2026 | 0.93% |
| Apr 26 | 0.85% |
| Mar 26 | 1.31% |
| Feb 26 | 1.16% |
| Jan 26 | 0.99% |
| Dec 25 | 1.14% |
| Nov 25 | 1.14% |
| Oct 25 | 0.98% |
| Sep 25 | 1.39% |
| Aug 25 | 1.22% |
| Jul 25 | 1.75% |
| Jun 25 | 1.02% |
| May 25 | 1.34% |
The Illinois inventionINDEX for May 2026 registered at 0.93%, achieving a C- rating and marking a modest recovery from the immediate downturn observed in the preceding month. In April 2026, the index dipped to 0.85% (D+ rating), which stands out as one of the lowest marks in recent years. This minor sequential gain of 0.08 percentage points provides a temporary stabilization, yet it fails to recapture the stronger momentum established earlier in the year. For instance, March 2026 saw a much healthier reading of 1.31% (B- rating), and February 2026 posted 1.16% (C+ rating). The current placement in the lower C-tier underscores a prolonged period of deceleration and highlighted instability within the state’s innovative sectors as the mid-year approaches.
When evaluated against the comprehensive 60-month historical data, the May 2026 score reveals a more concerning macro-level cooling trend. The overall historical average for this five-year span sits at approximately 1.36%, positioning the current performance well below the historical norm. This stands in stark contrast to the index’s peak achievements, most notably the historic high of 3.00% (A+ rating) recorded in October 2023, as well as robust performances like 2.25% in August 2023 and 2.20% in March 2022. While the current score remains safely above the absolute historical floor of 0.43% (F rating) from July 2023, the annual averages show a steady downshift from 1.47% in 2022 to 1.27% in 2025, culminating in a year-to-date average of just 1.05% for 2026.
Achieving higher scores and top-tier grades within the inventionINDEX yields substantial positive outcomes for the broader Illinois economy. When the index moves comfortably into the A or B ranges, it serves as an indicator of robust research and development activity, rapid patent output, and an efficient pipeline for commercializing novel technologies. This operational success builds immense confidence among institutional investors, venture capital firms, and corporate partners looking to inject seed money into regional projects. Furthermore, an elevated innovation index directly stimulates high-wage job creation across tech and engineering fields, fosters valuable synergy between private industries and prominent research universities, and secures the state’s reputation as a vital economic engine.
Conversely, sliding into lower grading tiers or enduring prolonged periods of depressed scores carries severe negative implications for regional economic health. Dropping toward the D and F brackets suggests an underlying stagnation in intellectual property production, a tightening of corporate R&D expenditures, or structural bottlenecks in the startup ecosystem. If these low marks persist, investor confidence can quickly deteriorate, causing vital capital to flee toward more dynamic and competitive state markets. Over time, an inactive innovation environment risks triggering a talent drain as top-tier researchers, engineers, and creative entrepreneurs migrate to areas with better funding opportunities, ultimately weakening the state’s long-term economic resilience and industrial diversification.
Discussion:
In May, the Illinois inventionINDEX scored a negative sentiment which was lower than the previous year’s average and underperformed the downward trend for the year. This is in contrast to the prior 12 months, which experienced an upward trend.
As the economy continues to stabilize in the post-pandemic era, it remains uncertain whether any backlog of applications still exists or if the department has returned to normal processing timelines. The inventionINDEX could also be affected by lingering consequences from the pandemic, such as company closures, reduced workforces, and limited R&D capabilities, which may still be impacting current operations.
Learn More:
Are you thinking of patenting any of your bright ideas? Did you know your research work could be eligible for the R&D Tax Credit and you can receive up to 14% back on your expenses? To find out more, please check out our free online eligibility test.
Swanson Reed’s Illinois office provides R&D tax credit consulting and advisory services to Chicago, Aurora, Rockford, Joliet, Naperville, Springfield, Peoria, Elgin, Waukegan, Champaign, Bloomington, Decatur, Evanston, Des Plaines, Berwyn, Wheaton, Carbondale, Mount Prospect, Oak Lawn and Skokie.
Feel free to book a quick teleconference with one of R&D tax specialists if you would like to learn more about R&D tax credit opportunities.
Who We Are:
Swanson Reed is the largest Specialist R&D tax credit advisory firm in the United States. With offices nationwide, we are one of the only firms globally to exclusively provide R&D tax credit consulting services to our clients. We have been exclusively providing R&D tax credit claim preparation and audit compliance solutions for over 30 years.
Swanson Reed hosts daily free webinars and provides free IRS CE and CPE credits for CPAs. For more information please visit us at www.swansonreed.com/free-webinars or contact your usual Swanson Reed representative.
Are you eligible?

Why choose us?

Pass an Audit?

What is the R&D Tax Credit?
The Research & Experimentation Tax Credit (or R&D Tax Credit), is a general business tax credit under Internal Revenue Code section 41 for companies that incur research and development (R&D) costs in the United States. The credits are a tax incentive for performing qualified research in the United States, resulting in a credit to a tax return. For the first three years of R&D claims, 6% of the total qualified research expenses (QRE) form the gross credit. In the 4th year of claims and beyond, a base amount is calculated, and an adjusted expense line is multiplied times 14%. Click here to learn more.
Never miss a deadline again

Stay up to date on IRS processes

Discover R&D in your industry

R&D Tax Credit Preparation Services
Swanson Reed is one of the only companies in the United States to exclusively focus on R&D tax credit preparation. Swanson Reed provides state and federal R&D tax credit preparation and audit services to all 50 states.
If you have any questions or need further assistance, please call or email our CEO, Damian Smyth on (800) 986-4725.
Feel free to book a quick teleconference with one of our national R&D tax credit specialists at a time that is convenient for you.
R&D Tax Credit Audit Advisory Services
creditARMOR is a sophisticated R&D tax credit insurance and AI-driven risk management platform. It mitigates audit exposure by covering defense expenses, including CPA, tax attorney, and specialist consultant fees—delivering robust, compliant support for R&D credit claims. Click here for more information about R&D tax credit management and implementation.
Our Fees
Swanson Reed offers R&D tax credit preparation and audit services at our hourly rates of between $195 – $395 per hour. We are also able offer fixed fees and success fees in special circumstances. Learn more at https://www.swansonreed.com/about-us/research-tax-credit-consulting/our-fees/


Choose your state


