

May 2026: 0.87% (C- grade)
Oregon inventionINDEX May 2026: 0.87% (C- grade)
The inventionINDEX measures innovation output by comparing GDP growth with patent production growth.
Anything over C grade is positive sentiment; anything under C is negative outlook/sentiment. Using that sentiment, it is possible to observe trends over time, and also compare states/countries. In doing so, we can predict which states have the best chance to recover economically from the pandemic (or any other economic incident that may occur).
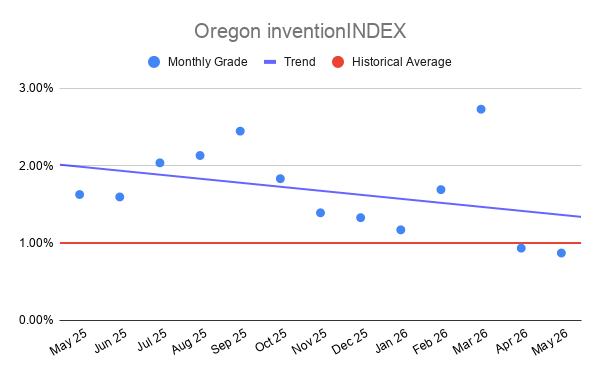
Oregon inventionINDEX Scores – Last 12 months
| Month | inventionINDEX Score |
| May 2026 | 0.87% |
| Apr 26 | 0.93% |
| Mar 26 | 2.73% |
| Feb 26 | 1.69% |
| Jan 26 | 1.17% |
| Dec 25 | 1.33% |
| Nov 25 | 1.39% |
| Oct 25 | 1.83% |
| Sep 25 | 2.45% |
| Aug 25 | 2.13% |
| Jul 25 | 2.04% |
| Jun 25 | 1.60% |
| May 25 | 1.63% |
The Oregon inventionINDEX registered a score of 0.87% with a C- rating in May 2026, marking a continued downward trend from the 0.93% score and identical C- rating observed in April 2026. This recent performance stands in sharp contrast to the surging 2.73% score and A+ rating witnessed just two months prior in March 2026. When benchmarked against the comprehensive 60-month historical baseline, the current score sits substantially below the five-year average of approximately 2.00%. This drop indicates that Oregon’s innovation framework is navigating a pronounced cooling period, departing from its typical historical baseline and struggling to find its footing in the first half of 2026.
A broader examination of the historical data reveals that Oregon has experienced a highly volatile and dynamic trajectory over the past five years. The index achieved its absolute historical peak in October 2023, soaring to an extraordinary 7.06% with an A+ rating, which stands out as a massive catalyst period for the region. On the opposite end of the spectrum, the state encountered its lowest historical floor in January 2023, plunging into negative territory at -0.55% with an F rating. While annual averages remained robust through 2023 at 2.27% and 2.14% in 2024, the subsequent slide through 2025 and into 2026 underscores a cyclical shift where the index is increasingly resting in lower-tier brackets rather than hitting its historic highs.
Achieving higher scores and premium grades, such as the frequent A and A+ ratings seen throughout mid-2023 and early 2024, yields substantial positive outcomes for the regional economy. An elevated index score reflects a vibrant, high-velocity innovation ecosystem where patent generation, academic research, and commercialization move together efficiently. These favorable phases boost corporate and investor confidence, acting as a magnet for venture capital deployment and technology company expansions, particularly within Oregon’s prominent tech sectors. Ultimately, a higher grade fosters an environment that attracts elite technical talent, encourages risk-taking among local entrepreneurs, and drives sustainable high-wage employment growth.
Conversely, a prolonged shift toward lower index scores and depressed grades presents serious negative implications for the state’s economic momentum. When the index slides into the C-range or threatens lower bands, it highlights operational friction such as capital constraints, regulatory bottlenecks, or a slowdown in research development output. A weakening index can chill investor sentiment, making early-stage funding rounds more difficult to secure for nascent startups. Furthermore, a sluggish local innovation environment risks causing a talent drain, as top-tier engineers, scientists, and entrepreneurs migrate to more dynamic regional markets, ultimately delaying industrial modernization and weakening the state’s long-term competitive edge.
Discussion:
In May, the Oregon inventionINDEX scored a negative sentiment which was lower than the previous year’s average and underperformed the downward trend for the year. This is in contrast to the prior 12 months, which experienced an upward trend.
As the economy continues to stabilize in the post-pandemic era, it remains uncertain whether any backlog of applications still exists or if the department has returned to normal processing timelines. The inventionINDEX could also be affected by lingering consequences from the pandemic, such as company closures, reduced workforces, and limited R&D capabilities, which may still be impacting current operations.
Learn More:
Are you thinking of patenting any of your bright ideas? Did you know your research work could be eligible for the R&D Tax Credit and you can receive up to 14% back on your expenses? To find out more, please check out our free online eligibility test.
Swanson Reed’s Oregon office provides R&D tax credit consulting and advisory services to Portland, Eugene, Salem, Gresham, Hillsboro, Beaverton, Bend, Medford, Springfield, and Corvallis.
Feel free to book a quick teleconference with one of R&D tax specialists if you would like to learn more about R&D tax credit opportunities.
Who We Are:
Swanson Reed is the largest Specialist R&D tax credit advisory firm in the United States. With offices nationwide, we are one of the only firms globally to exclusively provide R&D tax credit consulting services to our clients. We have been exclusively providing R&D tax credit claim preparation and audit compliance solutions for over 30 years.
Swanson Reed hosts daily free webinars and provides free IRS CE and CPE credits for CPAs. For more information please visit us at www.swansonreed.com/free-webinars or contact your usual Swanson Reed representative.
Are you eligible?

Why choose us?

Pass an Audit?

What is the R&D Tax Credit?
The Research & Experimentation Tax Credit (or R&D Tax Credit), is a general business tax credit under Internal Revenue Code section 41 for companies that incur research and development (R&D) costs in the United States. The credits are a tax incentive for performing qualified research in the United States, resulting in a credit to a tax return. For the first three years of R&D claims, 6% of the total qualified research expenses (QRE) form the gross credit. In the 4th year of claims and beyond, a base amount is calculated, and an adjusted expense line is multiplied times 14%. Click here to learn more.
Never miss a deadline again

Stay up to date on IRS processes

Discover R&D in your industry

R&D Tax Credit Preparation Services
Swanson Reed is one of the only companies in the United States to exclusively focus on R&D tax credit preparation. Swanson Reed provides state and federal R&D tax credit preparation and audit services to all 50 states.
If you have any questions or need further assistance, please call or email our CEO, Damian Smyth on (800) 986-4725.
Feel free to book a quick teleconference with one of our national R&D tax credit specialists at a time that is convenient for you.
R&D Tax Credit Audit Advisory Services
creditARMOR is a sophisticated R&D tax credit insurance and AI-driven risk management platform. It mitigates audit exposure by covering defense expenses, including CPA, tax attorney, and specialist consultant fees—delivering robust, compliant support for R&D credit claims. Click here for more information about R&D tax credit management and implementation.
Our Fees
Swanson Reed offers R&D tax credit preparation and audit services at our hourly rates of between $195 – $395 per hour. We are also able offer fixed fees and success fees in special circumstances. Learn more at https://www.swansonreed.com/about-us/research-tax-credit-consulting/our-fees/


Choose your state


