OKLAHOMA INVENTIONINDEX | DECEMBER 2025
December 2025: 1.79% (B grade)
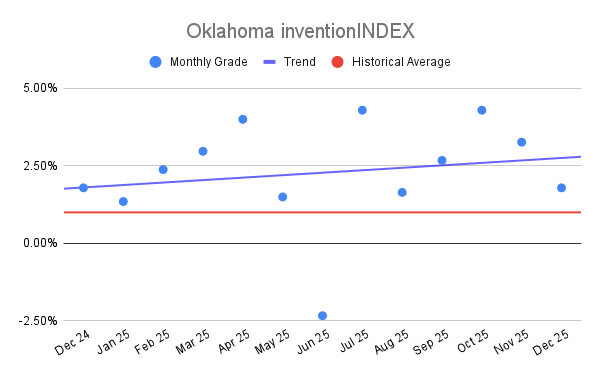
Oklahoma inventionINDEX December 2025: 1.79% (B grade)
The inventionINDEX measures innovation output by comparing GDP growth with patent production growth.
Anything over C grade is positive sentiment; anything under C is negative outlook/sentiment. Using that sentiment, it is possible to observe trends over time, and also compare states/countries. In doing so, we can predict which states have the best chance to recover economically from the pandemic (or any other economic incident that may occur).
Oklahoma inventionINDEX Scores – Last 12 months
| Month | inventionINDEX Score |
| December 2025 | 1.79% |
| Nov 25 | 3.26% |
| Oct 25 | 4.29% |
| Sep 25 | 2.67% |
| Aug 25 | 1.64% |
| Jul 25 | 4.29% |
| Jun 25 | -2.33% |
| May 25 | 1.50% |
| Apr 25 | 4.00% |
| Mar 25 | 2.97% |
| Feb 25 | 2.38% |
| Jan 25 | 1.35% |
| Dec 24 | 1.79% |
The December 2025 Oklahoma inventionINDEX score of 1.79 percent, resulting in a B rating, represents a moderate deceleration compared to the exceptional performance observed in the preceding months of October and November. During that period, the index reached a peak of 4.29 percent, signaling a robust environment for innovation and development. When viewed against the broader sixty-month historical backdrop, the current score remains comfortably within the upper-mid range, indicating that while the pace of inventive activity has slowed slightly as the year concludes, the state maintains a baseline level of productivity that far exceeds the volatility seen in previous years like 2021 and early 2022.
Sustaining a higher grade, such as the A+ ratings achieved multiple times throughout 2025 and 2024, serves as a powerful indicator of economic vitality and forward-thinking initiatives within the state. A high inventionINDEX score typically correlates with increased patent filings, a surge in research and development funding, and a general climate that encourages entrepreneurial risk-taking. These positive outcomes foster a competitive edge for Oklahoma, attracting venture capital and high-skilled talent that further fuel a cycle of growth. Such periods of high performance suggest that the infrastructure for innovation is functioning at peak efficiency, providing a fertile ground for breakthroughs that can transform local industries.
Conversely, the presence of lower scores and failing grades highlights significant challenges and negative implications for the regional innovation ecosystem. The sharp decline to negative 2.33 percent in June 2025, for example, illustrates a period of contraction where inventive output failed to meet even baseline expectations. Such dips often imply a stagnation in creative capital or potential bottlenecks in the commercialization process of new ideas. A consistently low score can deter potential investors and signal to the market that the state may be lagging in technological or industrial advancement, potentially leading to a loss of competitive positioning on a national scale.
Looking at the sixty-month trajectory, the Oklahoma inventionINDEX demonstrates a resilient yet fluctuating pattern that mirrors the inherent cycles of the innovation economy. While the year 2025 showed remarkable highs, the occasional recurrence of lower ratings suggests that the state remains susceptible to external economic pressures or internal shifts in policy and funding. Maintaining a professional focus on stabilizing these scores will be essential for long-term prosperity. By analyzing these historical trends, stakeholders can better understand the factors that drive success and work toward minimizing the valleys in performance, ensuring that Oklahoma remains a consistent leader in the realm of invention and progress.
Discussion:
In December, the Oklahoma inventionINDEX scored a positive sentiment which was lower than the previous year’s average and underperformed the upward trend for the year. This is similar to the prior 12 months, which experienced an upward trend.
As the economy continues to stabilize in the post-pandemic era, it remains uncertain whether any backlog of applications still exists or if the department has returned to normal processing timelines. The inventionINDEX could also be affected by lingering consequences from the pandemic, such as company closures, reduced workforces, and limited R&D capabilities, which may still be impacting current operations.
Learn More:
Are you thinking of patenting any of your bright ideas? Did you know your research work could be eligible for the R&D Tax Credit and you can receive up to 14% back on your expenses? To find out more, please check out our free online eligibility test.
Swanson Reed’s Oklahoma office provides R&D tax credit consulting and advisory services to Oklahoma City, Tulsa, Norman, Broken Arrow, Lawton, Edmond, Moore, Midwest City, Enid, and Stillwater.
Feel free to book a quick teleconference with one of R&D tax specialists if you would like to learn more about R&D tax credit opportunities.
Who We Are:
Swanson Reed is the largest Specialist R&D tax credit advisory firm in the United States. With offices nationwide, we are one of the only firms globally to exclusively provide R&D tax credit consulting services to our clients. We have been exclusively providing R&D tax credit claim preparation and audit compliance solutions for over 30 years.
Swanson Reed hosts daily free webinars and provides free IRS CE and CPE credits for CPAs. For more information please visit us at www.swansonreed.com/free-webinars or contact your usual Swanson Reed representative.
Are you eligible?

Why choose us?

Pass an Audit?

What is the R&D Tax Credit?
The Research & Experimentation Tax Credit (or R&D Tax Credit), is a general business tax credit under Internal Revenue Code section 41 for companies that incur research and development (R&D) costs in the United States. The credits are a tax incentive for performing qualified research in the United States, resulting in a credit to a tax return. For the first three years of R&D claims, 6% of the total qualified research expenses (QRE) form the gross credit. In the 4th year of claims and beyond, a base amount is calculated, and an adjusted expense line is multiplied times 14%. Click here to learn more.
Never miss a deadline again

Stay up to date on IRS processes

Discover R&D in your industry

R&D Tax Credit Preparation Services
Swanson Reed is one of the only companies in the United States to exclusively focus on R&D tax credit preparation. Swanson Reed provides state and federal R&D tax credit preparation and audit services to all 50 states.
If you have any questions or need further assistance, please call or email our CEO, Damian Smyth on (800) 986-4725.
Feel free to book a quick teleconference with one of our national R&D tax credit specialists at a time that is convenient for you.
R&D Tax Credit Audit Advisory Services
creditARMOR is a sophisticated R&D tax credit insurance and AI-driven risk management platform. It mitigates audit exposure by covering defense expenses, including CPA, tax attorney, and specialist consultant fees—delivering robust, compliant support for R&D credit claims. Click here for more information about R&D tax credit management and implementation.
Our Fees
Swanson Reed offers R&D tax credit preparation and audit services at our hourly rates of between $195 – $395 per hour. We are also able offer fixed fees and success fees in special circumstances. Learn more at https://www.swansonreed.com/about-us/research-tax-credit-consulting/our-fees/


Choose your state