

DELAWARE INVENTIONINDEX | JANUARY 2026
January 2026: 1.24% (C+ grade)
Delaware inventionINDEX January 2026: 1.24% (C+ grade)
The inventionINDEX measures innovation output by comparing GDP growth with patent production growth.
Anything over C grade is positive sentiment; anything under C is negative outlook/sentiment. Using that sentiment, it is possible to observe trends over time, and also compare states/countries. In doing so, we can predict which states have the best chance to recover economically from the pandemic (or any other economic incident that may occur).
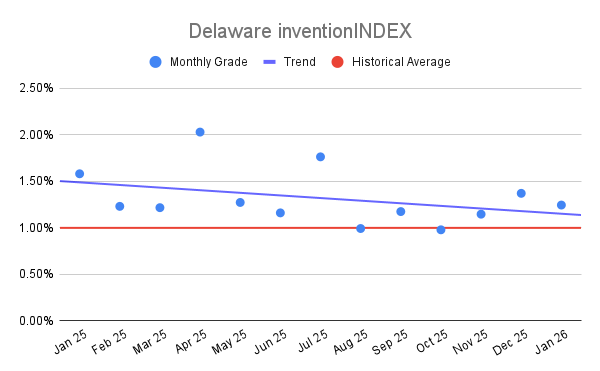
Delaware inventionINDEX Scores – Last 12 months
| Month | inventionINDEX Score |
| January 2026 | 1.24% |
| Dec 25 | 1.37% |
| Nov 25 | 1.15% |
| Oct 25 | 0.98% |
| Sep 25 | 1.17% |
| Aug 25 | 0.99% |
| Jul 25 | 1.76% |
| Jun 25 | 1.16% |
| May 25 | 1.27% |
| Apr 25 | 2.03% |
| Mar 25 | 1.22% |
| Feb 25 | 1.23% |
| Jan 25 | 1.58% |
The January 2026 Delaware inventionINDEX score of 1.24%, resulting in a C+ rating, represents a period of moderate stability within a historically volatile landscape. This current figure reflects a slight decrease from the 1.37% B- recorded in December 2025, continuing a minor downward trend from the final quarter of the previous year. However, when viewed against the broader five-year horizon, the current score remains significantly healthier than the levels seen during the index’s early years. For comparison, the score in January 2021 was a mere 0.04%, and the index spent much of 2021 and 2022 struggling to break out of the failing range. The current C+ rating suggests that while the index has cooled from its recent highs, it has established a much higher floor than was previously the norm.
Examining the 60-month historical trajectory reveals a dramatic recovery followed by a series of high-performance peaks. The index reached its absolute nadir in December 2021 with a score of -0.13%, marking a period of significant contraction in inventive output. Following that low point, the data shows a clear upward trend that culminated in an all-time high of 2.03% with an A+ rating in April 2025. This peak serves as a benchmark for the potential of the Delaware innovation ecosystem. Although the scores in late 2025 and early 2026 have retreated from these record-breaking levels, the general frequency of B and A ratings over the last 24 months indicates a more mature and productive environment compared to the stagnation observed three to four years ago.
The positive outcomes of achieving higher grades, such as the A and B ratings seen throughout 2024 and mid-2025, are substantial for the regional economy. High scores typically indicate a surge in research and development activity, a high volume of patent filings, and a robust climate for intellectual property commercialization. When the Delaware inventionINDEX reaches the 1.5% to 2.0% range, it signals to global investors and corporations that the state is a thriving hub for new ideas and technological advancement. These top-tier ratings act as a catalyst for economic growth, attracting specialized talent and fostering an atmosphere where creative risks are more likely to result in successful market disruptions.
In contrast, the negative implications of lower scores, particularly the F and D- ratings that dominated 2021 and early 2022, point toward systemic inertia. Scores falling below the 0.5% threshold often suggest that innovation is being stifled by economic uncertainty, lack of funding, or a decrease in collaborative research. These lower grades can lead to a loss of competitive advantage, making it difficult for the region to retain its brightest minds or attract new ventures. While the current rating of 1.24% is a notable step down from the 2.03% peak, it remains well above the historical danger zone. Maintaining this level of performance is crucial to avoiding the stagnation of the past and ensuring that Delaware remains a viable contender in the national innovation landscape.
Discussion:
In January, the Delaware inventionINDEX scored a positive sentiment which was lower than the previous year’s average but outperformed the downward trend for the year. This is in contrast to the prior 12 months, which experienced an upward trend.
As the economy continues to stabilize in the post-pandemic era, it remains uncertain whether any backlog of applications still exists or if the department has returned to normal processing timelines. The inventionINDEX could also be affected by lingering consequences from the pandemic, such as company closures, reduced workforces, and limited R&D capabilities, which may still be impacting current operations.
Learn More:
Are you thinking of patenting any of your bright ideas? Did you know your research work could be eligible for the R&D Tax Credit and you can receive up to 14% back on your expenses? To find out more, please check out our free online eligibility test.
Swanson Reed’s Delaware office provides R&D tax credit consulting and advisory services to Wilmington, Dover, Newark, Middletown and Smyrna.
Feel free to book a quick teleconference with one of R&D tax specialists if you would like to learn more about R&D tax credit opportunities.
Who We Are:
Swanson Reed is the largest Specialist R&D tax credit advisory firm in the United States. With offices nationwide, we are one of the only firms globally to exclusively provide R&D tax credit consulting services to our clients. We have been exclusively providing R&D tax credit claim preparation and audit compliance solutions for over 30 years.
Swanson Reed hosts daily free webinars and provides free IRS CE and CPE credits for CPAs. For more information please visit us at www.swansonreed.com/free-webinars or contact your usual Swanson Reed representative.
Are you eligible?

Why choose us?

Pass an Audit?

What is the R&D Tax Credit?
The Research & Experimentation Tax Credit (or R&D Tax Credit), is a general business tax credit under Internal Revenue Code section 41 for companies that incur research and development (R&D) costs in the United States. The credits are a tax incentive for performing qualified research in the United States, resulting in a credit to a tax return. For the first three years of R&D claims, 6% of the total qualified research expenses (QRE) form the gross credit. In the 4th year of claims and beyond, a base amount is calculated, and an adjusted expense line is multiplied times 14%. Click here to learn more.
Never miss a deadline again

Stay up to date on IRS processes

Discover R&D in your industry

R&D Tax Credit Preparation Services
Swanson Reed is one of the only companies in the United States to exclusively focus on R&D tax credit preparation. Swanson Reed provides state and federal R&D tax credit preparation and audit services to all 50 states.
If you have any questions or need further assistance, please call or email our CEO, Damian Smyth on (800) 986-4725.
Feel free to book a quick teleconference with one of our national R&D tax credit specialists at a time that is convenient for you.
R&D Tax Credit Audit Advisory Services
creditARMOR is a sophisticated R&D tax credit insurance and AI-driven risk management platform. It mitigates audit exposure by covering defense expenses, including CPA, tax attorney, and specialist consultant fees—delivering robust, compliant support for R&D credit claims. Click here for more information about R&D tax credit management and implementation.
Our Fees
Swanson Reed offers R&D tax credit preparation and audit services at our hourly rates of between $195 – $395 per hour. We are also able offer fixed fees and success fees in special circumstances. Learn more at https://www.swansonreed.com/about-us/research-tax-credit-consulting/our-fees/


Choose your state


