MASSACHUSETTS INVENTIONINDEX | JANUARY 2026
January 2026: 1.04% (C grade)
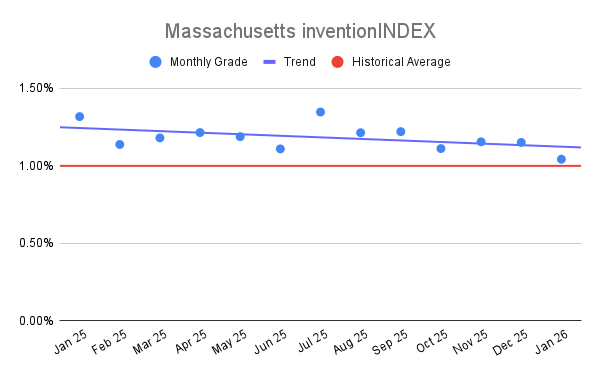
Massachusetts inventionINDEX January 2026: 1.04% (C grade)
The inventionINDEX measures innovation output by comparing GDP growth with patent production growth.
Anything over C grade is positive sentiment; anything under C is negative outlook/sentiment. Using that sentiment, it is possible to observe trends over time, and also compare states/countries. In doing so, we can predict which states have the best chance to recover economically from the pandemic (or any other economic incident that may occur).
Massachusetts inventionINDEX Scores – Last 12 months
| Month | inventionINDEX Score |
| January 2026 | 1.04% |
| Dec 25 | 1.15% |
| Nov 25 | 1.15% |
| Oct 25 | 1.11% |
| Sep 25 | 1.22% |
| Aug 25 | 1.21% |
| Jul 25 | 1.35% |
| Jun 25 | 1.11% |
| May 25 | 1.19% |
| Apr 25 | 1.21% |
| Mar 25 | 1.18% |
| Feb 25 | 1.14% |
| Jan 25 | 1.32% |
The January 2026 inventionINDEX score of 1.04% marks a notable departure from the historical performance observed over the last five years. Representing a ‘C’ rating, this figure stands as the lowest recorded point in the 61-month dataset provided. When compared to the same month in previous years, the decline is evident. For instance, January 2025 held a much stronger 1.32% score with an ‘A-‘ rating, while January 2024 reached 1.44% with an ‘A+’ rating. This downward trajectory suggests a cooling period for the Massachusetts innovation landscape as it enters the new year, contrasting sharply with the robust activity observed in the early months of the preceding four years.
Looking deeper into the historical trends, the current score reflects a significant shift from the periods of high performance that characterized much of 2021 through 2023. The index reached a five-year peak in October 2023 at 1.92%, a time when the ecosystem appeared to be operating at its maximum potential. Throughout 2024, the scores remained relatively resilient, frequently hovering in the ‘A’ and ‘B’ ranges. However, the latter half of 2025 showed signs of softening, with the score dropping from 1.35% in July to the current low. This gradual decline highlights a period of volatility that has moved the index away from its historical average, indicating that the current state of invention is facing more headwinds than in previous cycles.
A higher grade on the inventionINDEX, such as the ‘A+’ ratings frequently seen in 2021 and 2023, carries several positive outcomes for the regional economy. High scores typically correlate with a surge in patent filings, increased venture capital investment, and a thriving research and development sector. These periods of peak performance suggest a highly efficient pipeline where new ideas are successfully transformed into commercial products and services. Furthermore, a high rating serves as a beacon for global talent and corporate partnerships, reinforcing the reputation of Massachusetts as a premier destination for innovation. This environment fosters job creation and long-term economic stability by ensuring that the region remains at the forefront of emerging technologies.
Conversely, the negative implications of a lower score and a ‘C’ rating involve several risks to the regional innovation infrastructure. A score of 1.04% may indicate a slowdown in the pace of technological breakthroughs or a reduction in the resources available to entrepreneurs and researchers. Such a decline can lead to diminished investor confidence, making it more difficult for startups to secure the necessary funding for growth. If this downward trend persists, there is a risk of a talent drain, as skilled professionals might migrate to other hubs with more active innovation pipelines. Addressing these lower scores is essential for maintaining a competitive edge, as a stagnant index often points to systemic barriers that could hinder future economic progress.
Discussion:
In January, the Massachusetts inventionINDEX scored a positive sentiment which was lower than the previous year’s average and underperformed the downward trend for the year. This is similar to the prior 12 months, which experienced a slight downward trend.
As the economy continues to stabilize in the post-pandemic era, it remains uncertain whether any backlog of applications still exists or if the department has returned to normal processing timelines. The inventionINDEX could also be affected by lingering consequences from the pandemic, such as company closures, reduced workforces, and limited R&D capabilities, which may still be impacting current operations.
Learn More:
Are you thinking of patenting any of your bright ideas? Did you know your research work could be eligible for the R&D Tax Credit and you can receive up to 14% back on your expenses? To find out more, please check out our free online eligibility test.
Swanson Reed’s Massachusetts office provides R&D tax credit consulting and advisory services to Boston, Worcester, Springfield, Lowell, Cambridge, New Bedford, Brockton, Quincy, Lynn and Fall River.
Feel free to book a quick teleconference with one of R&D tax specialists if you would like to learn more about R&D tax credit opportunities.
Who We Are:
Swanson Reed is the largest Specialist R&D tax credit advisory firm in the United States. With offices nationwide, we are one of the only firms globally to exclusively provide R&D tax credit consulting services to our clients. We have been exclusively providing R&D tax credit claim preparation and audit compliance solutions for over 30 years.
Swanson Reed hosts daily free webinars and provides free IRS CE and CPE credits for CPAs. For more information please visit us at www.swansonreed.com/free-webinars or contact your usual Swanson Reed representative.
Are you eligible?

Why choose us?

Pass an Audit?

What is the R&D Tax Credit?
The Research & Experimentation Tax Credit (or R&D Tax Credit), is a general business tax credit under Internal Revenue Code section 41 for companies that incur research and development (R&D) costs in the United States. The credits are a tax incentive for performing qualified research in the United States, resulting in a credit to a tax return. For the first three years of R&D claims, 6% of the total qualified research expenses (QRE) form the gross credit. In the 4th year of claims and beyond, a base amount is calculated, and an adjusted expense line is multiplied times 14%. Click here to learn more.
Never miss a deadline again

Stay up to date on IRS processes

Discover R&D in your industry

R&D Tax Credit Preparation Services
Swanson Reed is one of the only companies in the United States to exclusively focus on R&D tax credit preparation. Swanson Reed provides state and federal R&D tax credit preparation and audit services to all 50 states.
If you have any questions or need further assistance, please call or email our CEO, Damian Smyth on (800) 986-4725.
Feel free to book a quick teleconference with one of our national R&D tax credit specialists at a time that is convenient for you.
R&D Tax Credit Audit Advisory Services
creditARMOR is a sophisticated R&D tax credit insurance and AI-driven risk management platform. It mitigates audit exposure by covering defense expenses, including CPA, tax attorney, and specialist consultant fees—delivering robust, compliant support for R&D credit claims. Click here for more information about R&D tax credit management and implementation.
Our Fees
Swanson Reed offers R&D tax credit preparation and audit services at our hourly rates of between $195 – $395 per hour. We are also able offer fixed fees and success fees in special circumstances. Learn more at https://www.swansonreed.com/about-us/research-tax-credit-consulting/our-fees/


Choose your state