

OREGON INVENTIONINDEX | JANUARY 2026
January 2026: 1.17% (C grade)
Oregon inventionINDEX January 2026: 1.17% (C grade)
The inventionINDEX measures innovation output by comparing GDP growth with patent production growth.
Anything over C grade is positive sentiment; anything under C is negative outlook/sentiment. Using that sentiment, it is possible to observe trends over time, and also compare states/countries. In doing so, we can predict which states have the best chance to recover economically from the pandemic (or any other economic incident that may occur).
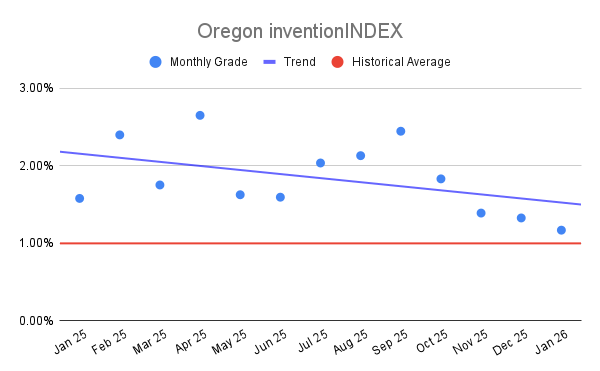
Oregon inventionINDEX Scores – Last 12 months
| Month | inventionINDEX Score |
| January 2026 | 1.17% |
| Dec 25 | 1.33% |
| Nov 25 | 1.39% |
| Oct 25 | 1.83% |
| Sep 25 | 2.45% |
| Aug 25 | 2.13% |
| Jul 25 | 2.04% |
| Jun 25 | 1.60% |
| May 25 | 1.63% |
| Apr 25 | 2.65% |
| Mar 25 | 1.75% |
| Feb 25 | 2.40% |
| Jan 25 | 1.58% |
The January 2026 Oregon inventionINDEX score stands at 1.17 percent, resulting in a C rating. This figure represents a continued downward trajectory for the index, marking the fourth consecutive month of decline since the 2.45 percent peak recorded in September 2025. When compared to the performance of late 2024 and early 2025, where scores frequently reached the A and B ranges, the current measurement suggests a cooling period in the region’s inventive momentum. This shift from a B- in June 2025 to the current C rating highlights a transition from moderate growth to a more stagnant phase.
Viewing the data through a wider lens, the current 1.17 percent score is significantly lower than the historical highs seen over the past five years. For instance, the index reached an exceptional peak of 7.06 percent in October 2023, a level far beyond the current output. While the state is performing better than the anomalous negative score of -0.55 percent seen in January 2023, the current rating is among the lowest recorded since early 2022. This regression places the recent performance in the bottom quartile of the 60-month historical data, indicating that the current pace of innovation is struggling to match the robust activity of previous cycles.
Higher scores and grades, such as the A+ ratings achieved in July 2024 and October 2023, typically correlate with a vibrant economic environment characterized by high levels of intellectual property development and entrepreneurial activity. A higher grade serves as a signal to investors and stakeholders that the region is a leader in technological or creative output, which can lead to increased funding and collaborative opportunities. When Oregon maintains scores in the A range, it suggests a healthy pipeline of new ideas and a competitive advantage in the marketplace. These periods of high performance foster an ecosystem where innovation is both sustainable and impactful.
Conversely, the drop to a C rating carries negative implications for the state’s innovation landscape. A lower score often indicates a reduction in the rate of patent filings, research breakthroughs, or startup formation, which may lead to a slower pace of job creation and economic diversification. The current rating suggests that Oregon may be facing obstacles such as reduced research and development spending or a decrease in the conversion of ideas into tangible inventions. If this trend continues, the region risks losing its competitive edge to other markets that are maintaining higher levels of inventive activity. Reversing this decline is essential to ensure that the local economy remains resilient and forward-looking.
Discussion:
In January, the Oregon inventionINDEX scored a positive sentiment which was lower than the previous year’s average and underperformed the downward trend for the year. This is similar to the prior 12 months, which experienced a slight downward trend.
As the economy continues to stabilize in the post-pandemic era, it remains uncertain whether any backlog of applications still exists or if the department has returned to normal processing timelines. The inventionINDEX could also be affected by lingering consequences from the pandemic, such as company closures, reduced workforces, and limited R&D capabilities, which may still be impacting current operations.
Learn More:
Are you thinking of patenting any of your bright ideas? Did you know your research work could be eligible for the R&D Tax Credit and you can receive up to 14% back on your expenses? To find out more, please check out our free online eligibility test.
Swanson Reed’s Oregon office provides R&D tax credit consulting and advisory services to Portland, Eugene, Salem, Gresham, Hillsboro, Beaverton, Bend, Medford, Springfield, and Corvallis.
Feel free to book a quick teleconference with one of R&D tax specialists if you would like to learn more about R&D tax credit opportunities.
Who We Are:
Swanson Reed is the largest Specialist R&D tax credit advisory firm in the United States. With offices nationwide, we are one of the only firms globally to exclusively provide R&D tax credit consulting services to our clients. We have been exclusively providing R&D tax credit claim preparation and audit compliance solutions for over 30 years.
Swanson Reed hosts daily free webinars and provides free IRS CE and CPE credits for CPAs. For more information please visit us at www.swansonreed.com/free-webinars or contact your usual Swanson Reed representative.
Are you eligible?

Why choose us?

Pass an Audit?

What is the R&D Tax Credit?
The Research & Experimentation Tax Credit (or R&D Tax Credit), is a general business tax credit under Internal Revenue Code section 41 for companies that incur research and development (R&D) costs in the United States. The credits are a tax incentive for performing qualified research in the United States, resulting in a credit to a tax return. For the first three years of R&D claims, 6% of the total qualified research expenses (QRE) form the gross credit. In the 4th year of claims and beyond, a base amount is calculated, and an adjusted expense line is multiplied times 14%. Click here to learn more.
Never miss a deadline again

Stay up to date on IRS processes

Discover R&D in your industry

R&D Tax Credit Preparation Services
Swanson Reed is one of the only companies in the United States to exclusively focus on R&D tax credit preparation. Swanson Reed provides state and federal R&D tax credit preparation and audit services to all 50 states.
If you have any questions or need further assistance, please call or email our CEO, Damian Smyth on (800) 986-4725.
Feel free to book a quick teleconference with one of our national R&D tax credit specialists at a time that is convenient for you.
R&D Tax Credit Audit Advisory Services
creditARMOR is a sophisticated R&D tax credit insurance and AI-driven risk management platform. It mitigates audit exposure by covering defense expenses, including CPA, tax attorney, and specialist consultant fees—delivering robust, compliant support for R&D credit claims. Click here for more information about R&D tax credit management and implementation.
Our Fees
Swanson Reed offers R&D tax credit preparation and audit services at our hourly rates of between $195 – $395 per hour. We are also able offer fixed fees and success fees in special circumstances. Learn more at https://www.swansonreed.com/about-us/research-tax-credit-consulting/our-fees/


Choose your state


