

RHODE ISLAND INVENTIONINDEX | JANUARY 2026
January 2026: 1.43% (B- grade)
Rhode Island inventionINDEX January 2026: 1.43% (B- grade)
The inventionINDEX measures innovation output by comparing GDP growth with patent production growth.
Anything over C grade is positive sentiment; anything under C is negative outlook/sentiment. Using that sentiment, it is possible to observe trends over time, and also compare states/countries. In doing so, we can predict which states have the best chance to recover economically from the pandemic (or any other economic incident that may occur).
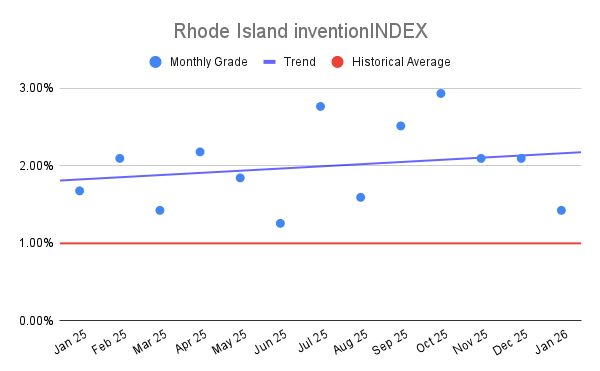
Rhode Island inventionINDEX Scores – Last 12 months
| Month | inventionINDEX Score |
| January 2026 | 1.43% |
| Dec 25 | 2.10% |
| Nov 25 | 2.10% |
| Oct 25 | 2.93% |
| Sep 25 | 2.51% |
| Aug 25 | 1.59% |
| Jul 25 | 2.77% |
| Jun 25 | 1.26% |
| May 25 | 1.84% |
| Apr 25 | 2.18% |
| Mar 25 | 1.43% |
| Feb 25 | 2.10% |
| Jan 25 | 1.68% |
The Rhode Island inventionINDEX for January 2026 stands at 1.43% with a B- rating, marking a notable shift from the stronger performance observed during the final quarter of 2025. Throughout the last 60 months, the index has demonstrated significant volatility, reaching peak heights of 3.77% in both June 2021 and September 2023. While the current score is an improvement over the historical low of 0.76% recorded in January 2022, it represents a downward trend from the 2.10% A-grade consistency maintained in late 2025. This historical perspective suggests that while the state’s innovation ecosystem remains functional, it is currently operating below the high-performance thresholds established during its most productive cycles over the past five years.
A higher score and an A-range rating carry several positive outcomes for the Rhode Island economic landscape. When the index climbs toward the 3.00% mark, as seen in October 2023 and July 2025, it typically reflects a robust environment for intellectual property development and entrepreneurial activity. These elevated scores signal to investors and stakeholders that the region possesses a high density of creative output and a supportive infrastructure for commercializing new ideas. Furthermore, a high rating often correlates with increased venture capital interest and the potential for long-term job creation within high-tech sectors, reinforcing Rhode Island’s position as a competitive hub for innovation in the New England area.
Conversely, a lower score and the accompanying C or D ratings present significant challenges for the state’s economic momentum. The historical data shows periods of stagnation, such as the early months of 2022 when scores dipped below 1.00%, resulting in C- and D+ ratings. Such declines often indicate a contraction in research and development investment or a slowdown in patent filings, which can lead to a loss of competitive advantage. If the index continues to soften from its current B- level, there is a risk of diminishing the state’s appeal to technical talent and innovative startups. Sustained lower scores can create a cycle of underinvestment, making it more difficult for the region to recover the momentum necessary to reach the A+ benchmarks seen in previous years.
In summary, the 60-month history of the Rhode Island inventionINDEX reveals a resilient but fluctuating innovation economy. The transition from the A-rated performance of late 2025 to the current 1.43% B- rating in January 2026 suggests a period of cooling that warrants professional observation. While the state has successfully avoided the deep troughs seen four years ago, maintaining a trajectory toward the 2.00% threshold is essential for fostering a top-tier environment for invention. By analyzing these long-term trends, stakeholders can better understand the cyclical nature of the region’s creative output and implement strategies to stabilize the index at a level that supports continuous economic growth and technological advancement.
Discussion:
In January, the Rhode Island inventionINDEX scored a positive sentiment which was lower than the previous year’s average and underperformed the upward trend for the year. This is in contrast to the prior 12 months, which experienced a slight downward trend.
As the economy continues to stabilize in the post-pandemic era, it remains uncertain whether any backlog of applications still exists or if the department has returned to normal processing timelines. The inventionINDEX could also be affected by lingering consequences from the pandemic, such as company closures, reduced workforces, and limited R&D capabilities, which may still be impacting current operations.
Learn More:
Are you thinking of patenting any of your bright ideas? Did you know your research work could be eligible for the R&D Tax Credit and you can receive up to 14% back on your expenses? To find out more, please check out our free online eligibility test.
Swanson Reed’s Rhode Island office provides R&D tax credit consulting and advisory services to Providence, Warwick, Cranston, Pawtucket, and East Providence.
Feel free to book a quick teleconference with one of R&D tax specialists if you would like to learn more about R&D tax credit opportunities.
Who We Are:
Swanson Reed is the largest Specialist R&D tax credit advisory firm in the United States. With offices nationwide, we are one of the only firms globally to exclusively provide R&D tax credit consulting services to our clients. We have been exclusively providing R&D tax credit claim preparation and audit compliance solutions for over 30 years.
Swanson Reed hosts daily free webinars and provides free IRS CE and CPE credits for CPAs. For more information please visit us at www.swansonreed.com/free-webinars or contact your usual Swanson Reed representative.
Are you eligible?

Why choose us?

Pass an Audit?

What is the R&D Tax Credit?
The Research & Experimentation Tax Credit (or R&D Tax Credit), is a general business tax credit under Internal Revenue Code section 41 for companies that incur research and development (R&D) costs in the United States. The credits are a tax incentive for performing qualified research in the United States, resulting in a credit to a tax return. For the first three years of R&D claims, 6% of the total qualified research expenses (QRE) form the gross credit. In the 4th year of claims and beyond, a base amount is calculated, and an adjusted expense line is multiplied times 14%. Click here to learn more.
Never miss a deadline again

Stay up to date on IRS processes

Discover R&D in your industry

R&D Tax Credit Preparation Services
Swanson Reed is one of the only companies in the United States to exclusively focus on R&D tax credit preparation. Swanson Reed provides state and federal R&D tax credit preparation and audit services to all 50 states.
If you have any questions or need further assistance, please call or email our CEO, Damian Smyth on (800) 986-4725.
Feel free to book a quick teleconference with one of our national R&D tax credit specialists at a time that is convenient for you.
R&D Tax Credit Audit Advisory Services
creditARMOR is a sophisticated R&D tax credit insurance and AI-driven risk management platform. It mitigates audit exposure by covering defense expenses, including CPA, tax attorney, and specialist consultant fees—delivering robust, compliant support for R&D credit claims. Click here for more information about R&D tax credit management and implementation.
Our Fees
Swanson Reed offers R&D tax credit preparation and audit services at our hourly rates of between $195 – $395 per hour. We are also able offer fixed fees and success fees in special circumstances. Learn more at https://www.swansonreed.com/about-us/research-tax-credit-consulting/our-fees/


Choose your state


