

ARIZONA INVENTIONINDEX | JANUARY 2026
January 2026: 2.28% (B grade)
Arizona inventionINDEX January 2026: 2.28% (B grade)
The inventionINDEX measures innovation output by comparing GDP growth with patent production growth.
Anything over C grade is positive sentiment; anything under C is negative outlook/sentiment. Using that sentiment, it is possible to observe trends over time, and also compare states/countries. In doing so, we can predict which states have the best chance to recover economically from the pandemic (or any other economic incident that may occur).
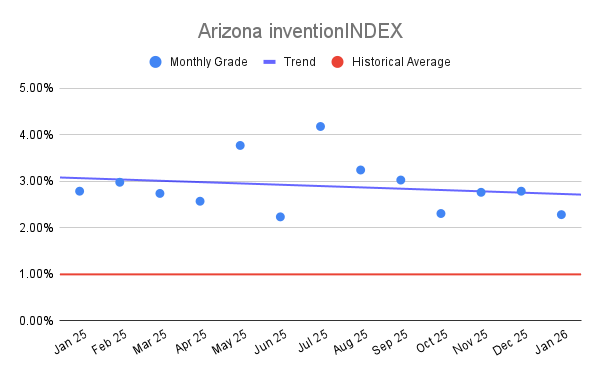
Arizona inventionINDEX Scores – Last 12 months
| Month | inventionINDEX Score |
| January 2026 | 2.28% |
| Dec 25 | 2.79% |
| Nov 25 | 2.76% |
| Oct 25 | 2.31% |
| Sep 25 | 3.03% |
| Aug 25 | 3.24% |
| Jul 25 | 4.18% |
| Jun 25 | 2.24% |
| May 25 | 3.77% |
| Apr 25 | 2.57% |
| Mar 25 | 2.74% |
| Feb 25 | 2.98% |
| Jan 25 | 2.79% |
The January 2026 inventionINDEX score of 2.28% represents a conservative entry into the new year, positioning Arizona within the ‘B’ rating category. When viewed against the historical backdrop of the last sixty months, this figure indicates a period of relative cooling compared to the high-performance cycles seen in early 2024. Specifically, the current score reflects a decrease from the 2.79% recorded in January 2025 and is significantly lower than the outlier peak of 7.25% observed in January 2024. While the state has successfully avoided the lower ‘C+’ thresholds that appeared during various intervals in 2022 and 2023, the current trajectory suggests a stabilization at a mid-range level rather than a immediate return to the robust ‘A’ ratings seen during the latter half of 2025.
Achieving a higher grade, such as the ‘A+’ ratings achieved in early 2024 and mid-2025, signals a thriving ecosystem for intellectual property and technological advancement. A higher inventionINDEX score typically correlates with increased venture capital interest, a surge in patent filings, and a more competitive labor market for highly skilled researchers. When the index moves toward the 4% to 7% range, it suggests that the state’s strategic investments in research and development are yielding tangible results, fostering an environment where innovation can be commercialized efficiently. These periods of high performance reinforce Arizona’s reputation as a hub for emerging industries, potentially attracting corporate relocations and federal grants that further fuel the local economy.
Conversely, a decline in the index toward the lower ‘B’ or ‘C’ tiers brings several negative implications for the state’s economic momentum. A lower score, such as the 1.44% recorded in July 2023 or the current 2.28%, often indicates a slowdown in the output of new ideas or a bottleneck in the commercialization pipeline. Such stagnation can lead to reduced investor confidence and may cause talented innovators to seek opportunities in regions with more active invention indices. If the score remains consistently low, the lack of fresh intellectual property can result in a less diversified economy that is more vulnerable to market shifts, ultimately hindering long-term job growth in high-tech sectors.
The historical data illustrates that the inventionINDEX is subject to cyclical fluctuations, with the state frequently rebounding from lower scores to achieve superior ratings within a matter of months. While the current score marks a more subdued start to 2026, the overall five-year trend demonstrates a resilient foundation that has historically supported rapid recoveries following periods of contraction. Maintaining a trajectory that trends back toward the ‘A-‘ and ‘A’ range will be essential for ensuring that Arizona remains a leader in the national innovation landscape. By monitoring these shifts closely, stakeholders can identify the specific economic conditions that trigger growth and work to mitigate the factors that lead to periodic declines in the index.
Discussion:
In January, the Arizona inventionINDEX scored a positive sentiment which was lower than the previous year’s average and underperformed the downward trend for the year. This is similar to the prior 12 months, which experienced a downward trend.
As the economy continues to stabilize in the post-pandemic era, it remains uncertain whether any backlog of applications still exists or if the department has returned to normal processing timelines. The inventionINDEX could also be affected by lingering consequences from the pandemic, such as company closures, reduced workforces, and limited R&D capabilities, which may still be impacting current operations.
Learn More:
Are you thinking of patenting any of your bright ideas? Did you know your research work could be eligible for the R&D Tax Credit and you can receive up to 14% back on your expenses? To find out more, please check out our free online eligibility test.
Swanson Reed’s Arizona office provides R&D tax credit consulting and advisory services to Phoenix, Tucson, Mesa, Chandler, Glendale, Scottsdale, Gilbert, Tempe, Peoria and Surprise.
Feel free to book a quick teleconference with one of R&D tax specialists if you would like to learn more about R&D tax credit opportunities.
Who We Are:
Swanson Reed is the largest Specialist R&D tax credit advisory firm in the United States. With offices nationwide, we are one of the only firms globally to exclusively provide R&D tax credit consulting services to our clients. We have been exclusively providing R&D tax credit claim preparation and audit compliance solutions for over 30 years.
Swanson Reed hosts daily free webinars and provides free IRS CE and CPE credits for CPAs. For more information please visit us at www.swansonreed.com/free-webinars or contact your usual Swanson Reed representative.
Are you eligible?

Why choose us?

Pass an Audit?

What is the R&D Tax Credit?
The Research & Experimentation Tax Credit (or R&D Tax Credit), is a general business tax credit under Internal Revenue Code section 41 for companies that incur research and development (R&D) costs in the United States. The credits are a tax incentive for performing qualified research in the United States, resulting in a credit to a tax return. For the first three years of R&D claims, 6% of the total qualified research expenses (QRE) form the gross credit. In the 4th year of claims and beyond, a base amount is calculated, and an adjusted expense line is multiplied times 14%. Click here to learn more.
Never miss a deadline again

Stay up to date on IRS processes

Discover R&D in your industry

R&D Tax Credit Preparation Services
Swanson Reed is one of the only companies in the United States to exclusively focus on R&D tax credit preparation. Swanson Reed provides state and federal R&D tax credit preparation and audit services to all 50 states.
If you have any questions or need further assistance, please call or email our CEO, Damian Smyth on (800) 986-4725.
Feel free to book a quick teleconference with one of our national R&D tax credit specialists at a time that is convenient for you.
R&D Tax Credit Audit Advisory Services
creditARMOR is a sophisticated R&D tax credit insurance and AI-driven risk management platform. It mitigates audit exposure by covering defense expenses, including CPA, tax attorney, and specialist consultant fees—delivering robust, compliant support for R&D credit claims. Click here for more information about R&D tax credit management and implementation.
Our Fees
Swanson Reed offers R&D tax credit preparation and audit services at our hourly rates of between $195 – $395 per hour. We are also able offer fixed fees and success fees in special circumstances. Learn more at https://www.swansonreed.com/about-us/research-tax-credit-consulting/our-fees/


Choose your state


