May 2026: 1.36% (B- grade)
Federal inventionINDEX May 2026: 1.36% (B- grade)
The inventionINDEX measures innovation output by comparing GDP growth with patent production growth.
Anything over C grade is positive sentiment; anything under C is negative outlook/sentiment. Using that sentiment, it is possible to observe trends over time, and also compare states/countries. In doing so, we can predict which states have the best chance to recover economically from the pandemic (or any other economic incident that may occur).
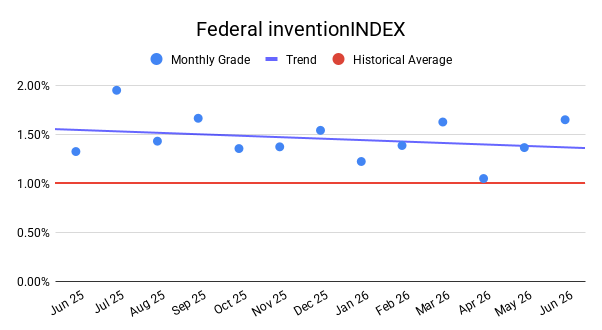
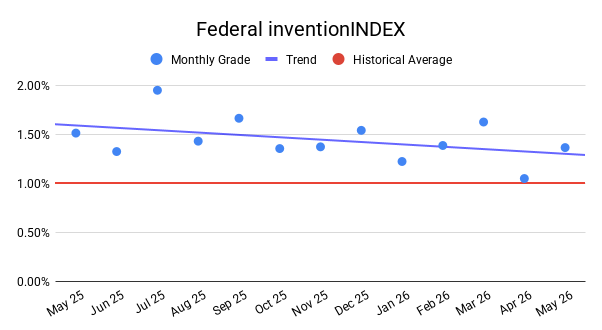
Historical Federal inventionINDEX Scores
The Federal inventionINDEX score for the past 12 months is shown in the table below.
| Month | inventionINDEX SCORE |
|---|---|
| May 2026 | 1.36% |
| April 2026 | 1.05% |
| March 2026 | 1.62% |
| February 2026 | 1.38% |
| January 2026 | 1.22% |
| December 2025 | 1.54% |
| November 2025 | 1.37% |
| October 2025 | 1.35% |
| September 2025 | 1.66% |
| August 2025 | 1.43% |
| July 2025 | 1.95% |
| June 2025 | 1.32% |
| May 2025 | 1.51% |
A retrospective look at the inventionINDEX data over the past sixty months reveals a dynamic landscape of innovation, with the most recent score of 1.36 percent in May 2026 marking a modest recovery from previous months. When evaluated against historical benchmarks, the current figures sit slightly below the long-term baseline, which frequently hovered around the 1.50 percent threshold. This position is a notable departure from the historical peak achieved in October 2023, when the index surged to a significant 2.31 percent with an A+ rating. Comparing current performance to these past milestones highlights a period of stabilization as the index attempts to regain its footing after recent fluctuations.
The trajectory leading into mid-2026 underscores a degree of volatility, particularly when observing the sharp decline to 1.05 percent in April 2026, which earned a C rating and represented one of the lowest points in the recorded timeline. This sudden drop stood in stark contrast to the stronger opening of the spring season in March 2026, which reached 1.62 percent. Historically, the index has demonstrated an ability to bounce back from similar troughs, such as the decline to 1.18 percent in January 2022 that was quickly followed by a robust recovery to 1.89 percent by March of that year. The recent upward movement from April to May suggests that market adjustments may once again be steering the index away from prolonged stagnation.
Achieving a higher grade and score on the inventionINDEX yields substantial positive outcomes for the broader economic and technological ecosystem. Higher scores, such as the numerous A and A+ ratings observed throughout 2023 and 2024, signify a robust environment ripe for intellectual property development, increased research funding, and heightened investor confidence. When the index climbs, it indicates that systemic support for breakthroughs is functioning optimally, which accelerates commercialization timelines and strengthens competitive advantages on a global scale. These elevated metrics serve as an encouraging signal for capital allocators, demonstrating that investment in novel technologies carries a higher probability of yielding impactful returns.
Conversely, the negative implications of a lower score or a declining grade present serious challenges for industry growth and sustainability. A depressed index score, exemplified by the C rating in April 2026 or the C+ rating in January 2022, typically points to regulatory bottlenecks, diminished funding pipelines, or a general risk aversion among market participants. Prolonged periods of low scores can lead to a chilling effect on experimental research, forcing organizations to prioritize short-term survival over long-term discovery. This slowdown not only delays the introduction of vital advancements but also risks shifting the center of technological leadership to competing regions that offer more favorable conditions.
Discussion:
In May, the Federal inventionINDEX scored a positive sentiment which was lower than the previous year’s average but outperformed the downward trend for the year. This is similar to the prior 12 months, which experienced a slight downward trend.
As the economy continues to stabilize in the post-pandemic era, it remains uncertain whether any backlog of applications still exists or if the department has returned to normal processing timelines. The inventionINDEX could also be affected by lingering consequences from the pandemic, such as company closures, reduced workforces, and limited R&D capabilities, which may still be impacting current operations.
Learn More:
Are you thinking of patenting any of your bright ideas? Did you know your research work could be eligible for the R&D Tax Credit and you can receive up to 14% back on your expenses? To find out more, please check out our free online eligibility test.
Swanson Reed provides R&D tax credit consulting and advisory services to companies in all 50 U.S. States.
Feel free to book a quick teleconference with one of R&D tax specialists if you would like to learn more about R&D tax credit opportunities.
Who We Are:
Swanson Reed is the largest Specialist R&D tax credit advisory firm in the United States. With offices nationwide, we are one of the only firms globally to exclusively provide R&D tax credit consulting services to our clients. We have been exclusively providing R&D tax credit claim preparation and audit compliance solutions for over 30 years.
Swanson Reed hosts daily free webinars and provides free IRS CE and CPE credits for CPAs. For more information please visit us at www.swansonreed.com/free-webinars or contact your usual Swanson Reed representative.