
January 2026: 0.93% (C- grade)
Ohio inventionINDEX January 2026: 0.93% (C- grade)
The inventionINDEX measures innovation output by comparing GDP growth with patent production growth.
Anything over C grade is positive sentiment; anything under C is negative outlook/sentiment. Using that sentiment, it is possible to observe trends over time, and also compare states/countries. In doing so, we can predict which states have the best chance to recover economically from the pandemic (or any other economic incident that may occur).
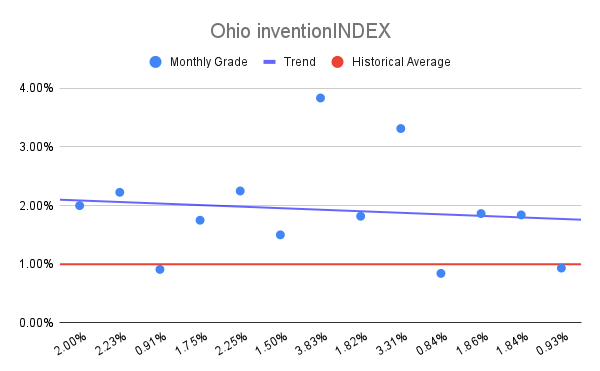
Ohio inventionINDEX Scores – Last 12 months
| Month | inventionINDEX Score |
| January 2026 | 0.93% |
| Dec 25 | 1.84% |
| Nov 25 | 1.86% |
| Oct 25 | 0.84% |
| Sep 25 | 3.31% |
| Aug 25 | 1.82% |
| Jul 25 | 3.83% |
| Jun 25 | 1.50% |
| May 25 | 2.25% |
| Apr 25 | 1.75% |
| Mar 25 | 0.91% |
| Feb 25 | 2.23% |
| Jan 25 | 2.00% |
The January 2026 inventionINDEX score for Ohio stands at 0.93%, reflecting a C- rating. When examined against the historical data from the past sixty months, this figure represents a period of significant cooling compared to the high-water marks of the previous years. Specifically, this current score is a sharp decline from the July 2025 peak of 3.83% and sits far below the five-year record of 4.56% achieved in January 2024. While the index has historically shown a high degree of volatility, the recent trend toward scores below the 1.00% threshold suggests a transition into a more conservative phase of innovation activity within the state.
A higher score on the inventionINDEX, such as the A and A+ ratings seen frequently throughout 2023 and 2024, indicates a robust and thriving intellectual property ecosystem. During these peak periods, where scores often exceeded 3.00%, Ohio demonstrated a heightened capacity for generating new ideas, securing patents, and attracting research and development investment. These positive outcomes foster a competitive economic environment, signaling to global markets that the state is a leader in technological advancement. Such periods of high performance typically correlate with increased job creation in high-tech sectors and a more resilient local economy driven by original intellectual contributions.
Conversely, a lower score like the current 0.93% or the historical low of -3.17% recorded in February 2021 brings several negative implications for the state’s industrial trajectory. Lower ratings generally point toward a stagnation in the creative pipeline, which can result from reduced funding, a lack of institutional support for inventors, or broader economic friction. When the index dips into the C or D ranges, it may signal that Ohio is losing its competitive edge to other regions that are more aggressively pursuing technological breakthroughs. This lack of momentum can lead to a talent drain, as researchers and entrepreneurs may seek more fertile ground for their projects, ultimately slowing the state’s overall economic growth.
Looking at the broader sixty-month trajectory, the Ohio inventionINDEX has moved through several distinct cycles of expansion and contraction. The current dip following the relatively strong performance in mid-2025 suggests that the state is currently struggling to maintain the momentum required for an A-tier rating. To return to the levels of success seen in early 2024, there must be a renewed focus on the factors that drive these scores upward, such as streamlined patent processes and increased collaboration between academia and industry. Maintaining a professional and analytical view of these fluctuations is essential for stakeholders who aim to stabilize the index and push Ohio back toward a consistent B+ or A rating in the coming months.
Discussion:
In January, the Ohio inventionINDEX scored a negative sentiment which was lower than the previous year’s average and underperformed the upward trend for the year. This is in contrast to the prior 12 months, which experienced a considerable downward trend.
As the economy continues to stabilize in the post-pandemic era, it remains uncertain whether any backlog of applications still exists or if the department has returned to normal processing timelines. The inventionINDEX could also be affected by lingering consequences from the pandemic, such as company closures, reduced workforces, and limited R&D capabilities, which may still be impacting current operations.
Learn More:
Are you thinking of patenting any of your bright ideas? Did you know your research work could be eligible for the R&D Tax Credit and you can receive up to 14% back on your expenses? To find out more, please check out our free online eligibility test.
Swanson Reed’s Ohio office provides R&D tax credit consulting and advisory services to Columbus, Cleveland, Cincinnati, Toledo, Akron, Dayton, Parma, Canton, Youngstown, Lorain, Hamilton, Springfield, Kettering, Elyria, Lakewood, Cuyahoga Falls, Middletown, Euclid, Newark and Mansfield.
Feel free to book a quick teleconference with one of R&D tax specialists if you would like to learn more about R&D tax credit opportunities.
Who We Are:
Swanson Reed is the largest Specialist R&D tax credit advisory firm in the United States. With offices nationwide, we are one of the only firms globally to exclusively provide R&D tax credit consulting services to our clients. We have been exclusively providing R&D tax credit claim preparation and audit compliance solutions for over 30 years.
Swanson Reed hosts daily free webinars and provides free IRS CE and CPE credits for CPAs. For more information please visit us at www.swansonreed.com/free-webinars or contact your usual Swanson Reed representative.
Are you eligible?

Why choose us?

Pass an Audit?

What is the R&D Tax Credit?
The Research & Experimentation Tax Credit (or R&D Tax Credit), is a general business tax credit under Internal Revenue Code section 41 for companies that incur research and development (R&D) costs in the United States. The credits are a tax incentive for performing qualified research in the United States, resulting in a credit to a tax return. For the first three years of R&D claims, 6% of the total qualified research expenses (QRE) form the gross credit. In the 4th year of claims and beyond, a base amount is calculated, and an adjusted expense line is multiplied times 14%. Click here to learn more.
Never miss a deadline again

Stay up to date on IRS processes

Discover R&D in your industry

R&D Tax Credit Preparation Services
Swanson Reed is one of the only companies in the United States to exclusively focus on R&D tax credit preparation. Swanson Reed provides state and federal R&D tax credit preparation and audit services to all 50 states.
If you have any questions or need further assistance, please call or email our CEO, Damian Smyth on (800) 986-4725.
Feel free to book a quick teleconference with one of our national R&D tax credit specialists at a time that is convenient for you.
R&D Tax Credit Audit Advisory Services
creditARMOR is a sophisticated R&D tax credit insurance and AI-driven risk management platform. It mitigates audit exposure by covering defense expenses, including CPA, tax attorney, and specialist consultant fees—delivering robust, compliant support for R&D credit claims. Click here for more information about R&D tax credit management and implementation.
Our Fees
Swanson Reed offers R&D tax credit preparation and audit services at our hourly rates of between $195 – $395 per hour. We are also able offer fixed fees and success fees in special circumstances. Learn more at https://www.swansonreed.com/about-us/research-tax-credit-consulting/our-fees/


Choose your state


