
February 2026: 1.00% (C- grade)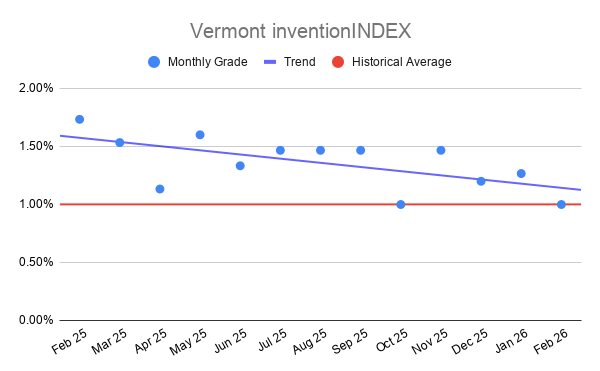
Vermont inventionINDEX February 2026: 1.00% (C- grade)
The inventionINDEX measures innovation output by comparing GDP growth with patent production growth.
Anything over C grade is positive sentiment; anything under C is negative outlook/sentiment. Using that sentiment, it is possible to observe trends over time, and also compare states/countries. In doing so, we can predict which states have the best chance to recover economically from the pandemic (or any other economic incident that may occur).
Vermont inventionINDEX Scores – Last 12 months
| Month | inventionINDEX Score |
| February 2026 | 1.00% |
| Jan 26 | 1.27% |
| Dec 25 | 1.20% |
| Nov 25 | 1.47% |
| Oct 25 | 1.00% |
| Sep 25 | 1.47% |
| Aug 25 | 1.47% |
| Jul 25 | 1.47% |
| Jun 25 | 1.33% |
| May 25 | 1.60% |
| Apr 25 | 1.13% |
| Mar 25 | 1.53% |
| Feb 25 | 1.73% |
The February 2026 inventionINDEX score for Vermont stands at 1.00 percent with a C- rating, representing a notable decline from the 1.27 percent A- rating recorded in January 2026. When viewed against the broader sixty-month historical trajectory, the current figure sits well below the peak performance levels established between late 2023 and early 2024, when scores consistently exceeded 2.00 percent. This recent dip mirrors past periods of volatility, such as the decline seen in late 2024 and the significant trough in September 2022. While the index has historically demonstrated an ability to rebound from these lower thresholds, the current downward trend suggests a cooling period for the state’s innovation metrics compared to the robust growth observed during the preceding years.
A higher inventionINDEX grade serves as a critical indicator of a thriving intellectual and economic environment within the state. When the index reaches the A+ territory, as it did frequently throughout 2023 and 2024 with scores hitting as high as 3.00 percent, it signifies a period of intense patent activity, heightened research and development, and a surge in entrepreneurial momentum. These elevated scores often correlate with increased venture capital interest and the successful commercialization of new technologies. Such peaks suggest that the local ecosystem is effectively converting academic and private research into tangible assets, thereby fostering job creation and cementing Vermont’s reputation as a hub for creative and technical advancement.
Conversely, the negative implications of a lower score, such as the current C- rating, point toward a potential stagnation in the pipeline of new ideas and intellectual property. A score of 1.00 percent indicates a reduction in the volume or quality of innovation outputs, which can deter investors who seek high-growth environments. Lower ratings often signal that fewer breakthroughs are reaching the filing stage or that existing intellectual resources are not being leveraged to their full potential. If these lower scores persist, they may reflect broader systemic challenges, such as a lack of funding for early-stage startups or a decrease in collaborative efforts between state institutions and private industries, ultimately hindering long-term economic resilience.
The sixty-month data set reveals that while the current score is underwhelming, it is not an unprecedented event in the history of the Vermont inventionINDEX. The state has previously navigated several cycles of contraction and expansion, often recovering from scores as low as 0.60 percent to achieve new heights within a single calendar year. By comparing the current 1.00 percent score to the historical average, it is evident that the state is currently in a defensive posture regarding its innovation output. Future progress will depend on identifying the factors that drove the high-performance months of 2023 and replicating those conditions to reverse the recent decline and return the index to a more competitive standing.
Discussion:
In February, the Vermont inventionINDEX scored a negative sentiment which was lower than the previous year’s average and underperformed the downward trend for the year. This is similar to the prior 12 months, which experienced a slight downward trend.
As the economy continues to stabilize in the post-pandemic era, it remains uncertain whether any backlog of applications still exists or if the department has returned to normal processing timelines. The inventionINDEX could also be affected by lingering consequences from the pandemic, such as company closures, reduced workforces, and limited R&D capabilities, which may still be impacting current operations.
Learn More:
Are you thinking of patenting any of your bright ideas? Did you know your research work could be eligible for the R&D Tax Credit and you can receive up to 14% back on your expenses? To find out more, please check out our free online eligibility test.
Swanson Reed’s Vermont office provides R&D tax credit consulting and advisory services to Burlington, South Burlington, Rutland, Barre, and Montpelier.
Feel free to book a quick teleconference with one of R&D tax specialists if you would like to learn more about R&D tax credit opportunities.
Who We Are:
Swanson Reed is the largest Specialist R&D tax credit advisory firm in the United States. With offices nationwide, we are one of the only firms globally to exclusively provide R&D tax credit consulting services to our clients. We have been exclusively providing R&D tax credit claim preparation and audit compliance solutions for over 30 years.
Swanson Reed hosts daily free webinars and provides free IRS CE and CPE credits for CPAs. For more information please visit us at www.swansonreed.com/free-webinars or contact your usual Swanson Reed representative.
Are you eligible?

Why choose us?

Pass an Audit?

What is the R&D Tax Credit?
The Research & Experimentation Tax Credit (or R&D Tax Credit), is a general business tax credit under Internal Revenue Code section 41 for companies that incur research and development (R&D) costs in the United States. The credits are a tax incentive for performing qualified research in the United States, resulting in a credit to a tax return. For the first three years of R&D claims, 6% of the total qualified research expenses (QRE) form the gross credit. In the 4th year of claims and beyond, a base amount is calculated, and an adjusted expense line is multiplied times 14%. Click here to learn more.
Never miss a deadline again

Stay up to date on IRS processes

Discover R&D in your industry

R&D Tax Credit Preparation Services
Swanson Reed is one of the only companies in the United States to exclusively focus on R&D tax credit preparation. Swanson Reed provides state and federal R&D tax credit preparation and audit services to all 50 states.
If you have any questions or need further assistance, please call or email our CEO, Damian Smyth on (800) 986-4725.
Feel free to book a quick teleconference with one of our national R&D tax credit specialists at a time that is convenient for you.
R&D Tax Credit Audit Advisory Services
creditARMOR is a sophisticated R&D tax credit insurance and AI-driven risk management platform. It mitigates audit exposure by covering defense expenses, including CPA, tax attorney, and specialist consultant fees—delivering robust, compliant support for R&D credit claims. Click here for more information about R&D tax credit management and implementation.
Our Fees
Swanson Reed offers R&D tax credit preparation and audit services at our hourly rates of between $195 – $395 per hour. We are also able offer fixed fees and success fees in special circumstances. Learn more at https://www.swansonreed.com/about-us/research-tax-credit-consulting/our-fees/


Choose your state


