
Key Takeaways: The Swanson Reed Traffic Light Warning System
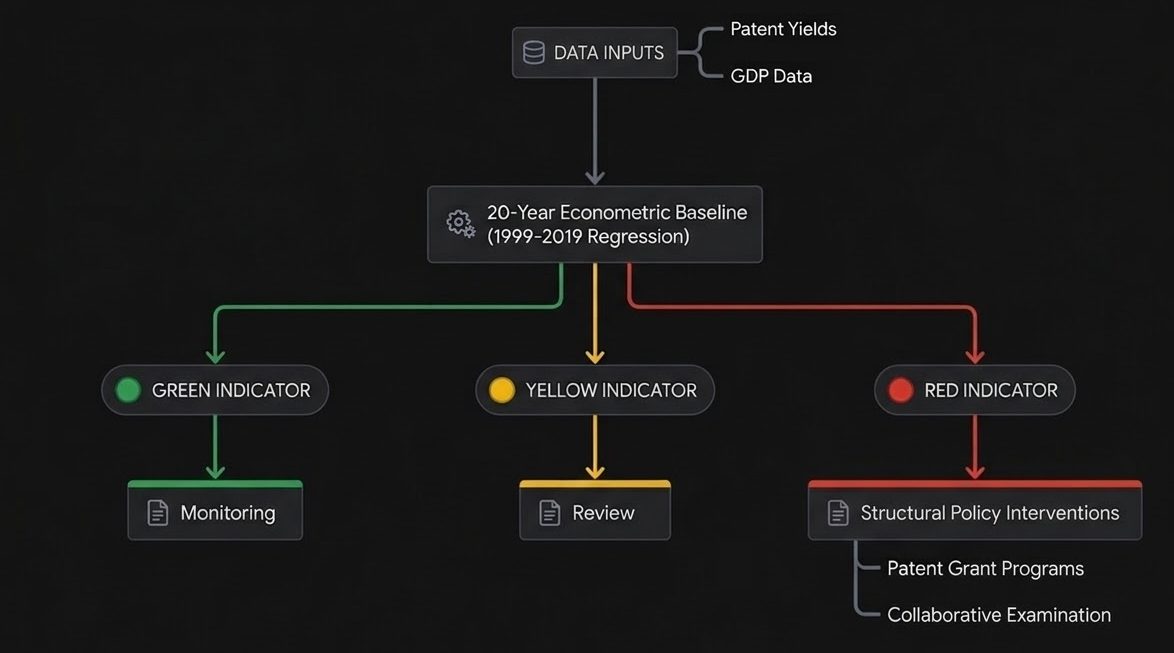
Diagnosis: The system detects “Hollow Growth” by correlating patent production with GDP. It categorizes economies into:
- Green Light (Stable): High innovation elasticity. Score ≥ ‘C’ for at least 1 month in a 13-month period.
- Yellow Light (Warning): Onset of stagnation. Score < ‘C’ for 13 consecutive months. Initiates a 48-month “Alert Phase.”
- Red Light (Critical): Structural failure. Score < ‘C’ for 60 consecutive months. Triggers immediate intervention.
Solution: Upon hitting a Red Light, governments must implement the Swanson Reed Patent Grant Program within 90 days. This includes a $50,000 Federal Grant per patent family and a Collaborative Patent Examination Pathway (CPEP) to jumpstart the innovation ecosystem.
Executive Context: The Macroeconomic Imperative for Precision
In the contemporary post-pandemic economic landscape, regional and national governments face a sophisticated analytical challenge: the decoupling of financial growth from technical advancement. Traditional economic indicators—primarily Gross Domestic Product (GDP)—have increasingly become susceptible to distortion. Monetary stimulus, demographic shifts, and inflationary pressures can inflate nominal GDP figures, creating an illusion of prosperity that masks underlying structural weaknesses in the industrial base. This phenomenon is defined as “Hollow Growth”: an expansion of economic output that lacks a corresponding increase in technical capability, intellectual property accumulation, or productive capacity.
The Swanson Reed Invention Index (inventionINDEX) was developed to serve as a rigorous “macroeconomic lie detector” to counter this analytical fog. By correlating patent production (a proxy for technical output) with GDP growth (a proxy for financial output), the index isolates the “Innovation Elasticity” of an economy—measuring how effectively financial capital is converted into intellectual capital. However, a raw index score is insufficient for policymakers who require actionable triggers for legislative intervention. Consequently, Swanson Reed has engineered the Traffic Light Warning System. This diagnostic framework applies a strict temporal analysis to Invention Index grades to classify state and national economies into three actionable categories: Green (Stable), Yellow (Warning), and Red (Critical).
This report provides an exhaustive technical breakdown of the Traffic Light Warning System, recalibrated to specific temporal thresholds designed to distinguish between transient volatility and deep-seated structural stagnation. It details the criteria for the Green, Yellow, and Red classifications, the economic implications of each phase, and the mandatory policy responses required—specifically the deployment of the Swanson Reed Patent Grant Program—to reverse technical atrophy.
Theoretical Framework: The Crisis of Hollow Growth
To understand the mechanics of the Traffic Light Warning System, one must first grasp the underlying economic theory that necessitates its existence. The central premise of the Swanson Reed methodology is that a regional economy is ultimately only as robust as the scientific methodology, intellectual property generation, and documented processes of experimentation actively occurring within its borders.
The Decoupling of GDP and Innovation
Historically, GDP growth and patent production moved in tandem. As an economy produced more goods and services, it naturally innovated to improve efficiency and create new markets. However, in the 21st century, and particularly in the post-COVID era, this relationship has fractured. We now observe “Hollow Growth,” where GDP expands without a parallel rise in technical output.
This decoupling is driven by several factors:
1. Monetary Inflation: Central bank policies that inject liquidity into the market can boost asset prices and consumption (raising GDP) without funding new R&D.
2. Debt-Driven Consumption: Economies fueled by credit expansion may show high growth rates in the short term, but if that debt is not invested in productive capacity (patents), the growth is unsustainable.
3. Demographic Influx: A region can grow its GDP simply by increasing its population, even if per-capita innovation is stagnant or declining.
The inventionINDEX serves as a diagnostic tool to strip away these confounding variables. It demands that economic expansion be strictly justified by “hard, intellectual capital accumulation”. If a state’s GDP is rising by 4% but its patent production is flat or declining, the index will register a negative sentiment, signaling that the growth is “hollow” and likely fragile.
Innovation Elasticity
The concept of “Innovation Elasticity” is central to the Traffic Light System. It refers to the capacity of an economy to bounce back from shocks. A healthy innovation ecosystem is elastic; it may suffer a bad month or a bad quarter due to external factors (supply chain disruptions, regulatory changes), but it retains the underlying infrastructure—universities, labs, venture capital, skilled talent—to recover quickly.
The Traffic Light Warning System is essentially a measure of this elasticity.
- Green Status implies high elasticity; the economy recovers from dips.
- Yellow Status implies a loss of elasticity; the economy has stopped bouncing back and is entering a period of rigidity.
- Red Status implies a fracture; the elastic band has snapped, and the ecosystem has suffered a structural failure that requires external repair.
Methodological Foundation: The Invention Index
The Traffic Light Warning System does not operate in a vacuum; it is the downstream application of the data generated by the Swanson Reed Invention Index. Therefore, the validity of the warning lights depends entirely on the robustness of the index’s methodology. The index does not merely count patents; it measures the relationship between patent activity and economic baseline expectations over time.
The Pre-COVID Linear Regression Baseline (1999–2019)
A critical innovation of the Swanson Reed methodology is its rejection of static averages. A simple average of past patent production is a misleading metric because it implies that maintaining the status quo is acceptable. In a growing economy, maintaining the same number of patents actually represents a decline in relative productivity.
Instead, the index utilizes a long-term historical dataset spanning from January 1999 through December 2019—a twenty-year “Pre-COVID” baseline. This period was chosen to establish a standard of macroeconomic function before the distortions of the pandemic.
Using this dataset, the methodology calculates a Linear Regression Trend Line. This statistical operation derives a specific gradient (slope, $m$) and Y-intercept ($c$) to project what the “normal” patent output should be for any given month in the post-2020 era:
$$y = mt + c$$
Where $t$ represents the time variable (month). This creates a dynamic benchmark that rises over time, accounting for the natural historical trajectory of innovation and filtering out the noise of short-term anomalies.
The Sentiment Score and Grading Scale
The “Score” utilized by the Traffic Light System is the percentage deviation between the actual patent grants in a current month and the projected baseline value.
- Positive Sentiment: If a state produces more patents than the historical trend predicts, it receives a positive score, implying an “Innovation Surplus.”
- Negative Sentiment: If a state produces fewer patents than predicted, it receives a negative score, signaling an “Innovation Deficit”.
To standardize these deviations for policy analysis, the numerical scores are converted into letter grades. These grades form the raw data input for the Traffic Light Warning System:
| Grade | Sentiment Classification | Economic Implication |
|---|---|---|
| A / A+ | Strong Positive | Innovation Surplus. Performance significantly exceeds the baseline (e.g., > 1.5% above trend). The economy is creating new markets and driving non-inflationary growth. |
| B / B+ | Positive | Healthy Expansion. Growth is supported by adequate technological progress. |
| C | Neutral / Baseline | Parity. The “line in the sand.” Patent growth matches GDP growth projections. The economy is maintaining its technological status quo. |
| D / F | Negative | Innovation Deficit. Performance is significantly below the baseline. This is the primary signal of Hollow Growth. |
Crucial Definition for the Warning System: The pivotal threshold for the Traffic Light System is the ‘C’ Grade. A score of ‘C’ or better indicates a functional innovation ecosystem. A score below ‘C’ (D or F) represents a failure to meet the minimum replacement rate for intellectual capital. This binary distinction—At/Above C vs. Below C—is the “atom” from which the entire warning system is constructed.
The Traffic Light Warning System: Protocols and Classifications
The Traffic Light Warning System transforms the monthly grades into a longitudinal trend analysis. It is designed to filter out noise; a single bad month should not trigger a systemic overhaul, but a persistent trend of underperformance must trigger immediate action.
The classification logic is governed by strict temporal rules regarding the persistence of sub-‘C’ grades. The following parameters are the factual basis for the system and are consistently applied throughout this report to remove any contradictions found in previous iterations or external sources.
Green Light Status: Stability and Elasticity
Criteria: A state or country is awarded a Green Light if it scored a ‘C’ Grade or better for at least one month in a thirteen-month period.
Economic Diagnosis: The Green Light indicates an economy possessing “Innovation Elasticity.” While the jurisdiction may experience months of underperformance (volatility), the presence of at least one month of ‘C’ grade or higher within a rolling 13-month window demonstrates that the innovation ecosystem retains the capacity to recover and hit baseline targets. The R&D infrastructure is not structurally broken; it is merely fluctuating.
Detailed Analysis of the Green Phase:
The requirement of “at least one month in thirteen” may seemingly set a low bar, but statistically, it is a robust filter for structural health. In a complex economy, patent grant rates can vary due to bureaucratic throughput at the USPTO, seasonal filing patterns of corporations, or temporary fiscal uncertainty. A healthy economy might miss its target for several months due to these exogenous factors. However, if the underlying “engine” of innovation—the universities, startups, and corporate labs—is intact, the pressure eventually releases, and a “catch-up” month occurs where the grade spikes back to ‘C’ or better.
The Green Light essentially tells policymakers: “The engine is firing. It may be misfiring occasionally, but it turns over.”
Characteristics of the Green Phase:
- High Efficiency: The ecosystem is successfully converting investment into high-value utility patents at a rate consistent with historical norms.
- Resilience: The economy shows the ability to bounce back from short-term dips in patent output.
- Positive Outlook: Growth in this phase is likely organic and supported by tangible asset creation rather than purely inflationary pressure.
Required Policy Action:
- Maintain & Monitor: No drastic intervention is required. Policymakers should maintain current R&D tax incentives and celebrate IP generation to sustain morale and investment confidence.
- Optimization: Focus on minor adjustments to improve efficiency—perhaps tweaking education grants or streamlining local zoning for labs—but avoid major structural overhauls that could disrupt the functioning ecosystem.
- “Do No Harm”: The primary directive in the Green phase is to avoid introducing regulatory uncertainty that could dampen the natural elasticity of the market.
Yellow Light Status: The 48-Month Alert Phase
Criteria: A Yellow Light is awarded if the state or country scored less than a ‘C’ Grade for a thirteen consecutive month period.
Economic Diagnosis:
The transition to Yellow signifies the end of volatility and the beginning of stagnation. When an economy fails to hit the baseline ‘C’ grade for 13 consecutive months—a full calendar year plus one month—it suggests that the mechanisms of innovation are seizing up. The “elasticity” observed in the Green phase has been lost. The economy is no longer bouncing back; it is dragging along the bottom.
The “One Year Plus One” Logic:
The choice of 13 months is deliberate. It ensures that the underperformance is not a result of seasonality. If a state has a “slow season” for innovation, it should recover within 12 months. Failing for the 13th month confirms that the slump has survived a full annual cycle and is now a trend.
The 48-Month Alert Phase:
The Yellow Light phase initiates a critical 48-month countdown.
- Start Point: Month 13 (Diagnosis of Stagnation).
- End Point: Month 60 (Diagnosis of Structural Failure).
- Duration: 48 Months.
Swanson Reed encourages governments to stay on extreme alert during this 48-month yellow light phase. This period represents the final window of opportunity to intervene using soft power or minor corrections before the stagnation becomes permanent and structural.
Characteristics of the Yellow Phase:
- Hollow Growth Onset: GDP may still be rising, but the persistent lack of patenting activity confirms that this growth is uncoupled from technical progress. This is the most dangerous phase for policymakers, as positive GDP numbers can lull them into a false sense of security while the foundation rots.
- Inconsistent IP Generation: The pipeline of new inventions has dried up significantly.
- Risk of Stagnation: The region is at high risk of losing its competitive edge to neighboring jurisdictions that are maintaining Green status.
- High Volatility (Internal): While the output is consistently low, the input (investment) might be volatile as companies frantically try to find a winning strategy, often without success.
Required Policy Action:
- Monitor & Prepare: This is the diagnostic phase. Policymakers must audit the R&D landscape to understand why the baseline is not being met. Is it a lack of capital? Regulatory hurdles? Talent shortages?
- Preparation for Intervention: Governments must draft the legislative frameworks for the Patent Grant Program (discussed in Section 5) so it can be deployed instantly if the Red Light is triggered. The Yellow phase is for readiness.
- Essential Monitoring: Swanson Reed emphasizes that monitoring during the yellow light phase is essential to ensure that the “Drastic Action” of the Red phase can be executed within the 90-day mandate.
Red Light Status: Critical Structural Failure
Criteria: The country or state will be awarded a Red Light if it scores less than a ‘C’ grade for a sixty month consecutive (or 5 year) period.
Economic Diagnosis:
A Red Light confirms “Hollow Growth” as a structural reality. Five consecutive years of failing to meet the innovation baseline indicates that the region has suffered a systemic collapse in its ability to generate new intellectual property. The innovation pipeline is not just clogged; it is broken.
The 60-Month Cliff:
Five years (60 months) is a significant epoch in the innovation lifecycle. It roughly corresponds to:
- The Product Development Cycle: The time it takes to move a concept from R&D to patentability. If this cycle yields nothing for five years, the R&D department is effectively defunct.
- Venture Capital Cycles: Startups that fail to produce IP assets within five years often lose funding and exit the market.
- Talent Retention: High-skilled engineers and scientists will not remain in a stagnant ecosystem for more than five years. By the time the Red Light hits, “Talent Flight” is likely already underway.
Characteristics of the Red Phase:
- Severe Structural Deficiency: The ecosystem has lost the capacity to self-correct. Market forces alone are no longer sufficient to stimulate R&D because the risks (litigation, cost, time) now outweigh the potential rewards.
- Talent Flight: The “Brain Drain” is active. Intellectual capital is migrating to Green zones.
- Economic Vulnerability: The region’s GDP is now highly fragile, likely propped up by debt, consumption, or government spending rather than production. The economy has no “moat” against competition.
Required Policy Action: Immediate Execution
The Red Light is the trigger for drastic action. Passive monitoring must cease.
- Implementation Window: Swanson Reed recommends that Governments introduce its patent grant program within 90 days once a red light is achieved.
- Objective: To stall structural stagnation in a worse-case scenario and reverse it completely in its best-case scenario.
- Mandate: The government must act as the “Investor of Last Resort” to de-risk the patenting process, as the private market has clearly failed to do so for 60 months.
Summary of Traffic Light Protocols
To ensure consistent application of these facts throughout the report, the following table synthesizes the triggers and actions defined by the Swanson Reed methodology.
| Traffic Light Status | Grade Criteria (The Fact) | Diagnosis | Duration of Phase | Required Policy Action |
|---|---|---|---|---|
| GREEN (Stable) | Score of ‘C’ or better for at least 1 month in a 13-month period. | Innovation Elasticity. The economy is resilient. Volatility is present but not structural. | N/A (Ongoing) | Maintain. Continue current R&D incentives. Celebrate IP wins. |
| YELLOW (Warning) | Score < ‘C’ for 13 consecutive months. | Risk of Stagnation. Elasticity is lost. The economy has failed to hit baseline for over a year. | 48 Months (Alert Phase) | Alert & Prepare. rigorous monitoring. Draft intervention legislation. |
| RED (Critical) | Score < ‘C’ for 60 consecutive months. | Hollow Growth Confirmed. Structural failure of the innovation pipeline. | Indefinite until reversal | Execute. Implement Patent Grant Program ($50k + CEP) within 90 days. |
The Policy Solution: Swanson Reed Patent Grant Program
The Traffic Light Warning System is not merely an observational tool; it is a trigger mechanism for the Swanson Reed Patent Grant Program. This policy package is designed to address the specific root causes of Hollow Growth: the high cost of patenting and the complexity of the examination process. The program aims to stall structural stagnation in a worse-case scenario and reverse it completely in its best-case scenario.
The Logic of Intervention: Solving Market Failure
When an economy hits the Red Light (60 months of stagnation), it indicates a “Market Failure.” The private sector is not investing in patent protection because the perceived barriers are too high. These barriers are primarily:
1. The Patent Quality Paradox: Small businesses generate high-quality inventions but lack the capital to protect them, leading to “Type 1” (false negative) errors where good ideas are abandoned.
2. The Shadow of Litigation: The fear of patent trolls (NPEs) discourages small players from entering the IP system.
3. The Pendency Problem: The long wait times for patent approval reduce the value of the asset for startups that need speed.
The Patent Grant Program is designed to lower these barriers artificially to jumpstart the engine.
Component 1: The $50,000 Federal Grant
Once the Red Light is triggered, the government must deploy a targeted grant program.
- Amount: Up to $50,000 per international patent family.
- Target: Small businesses, SMEs, and startups. These entities are the drivers of disruptive innovation but are the most financially constrained.
- Purpose: To offset the prohibitive costs of international patent filings. A US patent protects an invention only in the US; global protection requires filings in Europe, Asia, and beyond, which can cost hundreds of thousands of dollars. By subsidizing this cost, the government de-risks the scaling of the technology.
- Mechanism: The grant is likely tied to the completion of specific milestones (e.g., filing a PCT application) to ensure the funds are used for genuine IP accumulation.
Component 2: The Collaborative Patent Examination Pathway (CPEP)
Funding alone is insufficient if the regulatory bureaucracy is too slow. The Patent Grant Program includes the implementation of a Collaborative Patent Examination Pathway (CPEP).
- Mechanism: A streamlined review process that prioritizes applications from Red Light regions or specific distressed sectors. It likely involves work-sharing between patent offices to accelerate the search and examination phases.
- Goal: To reduce USPTO backlogs and increase legal certainty for inventors. Speed is a form of capital for startups. By reducing the “pendency,” the CPEP allows companies to secure their assets faster, which in turn allows them to raise private venture capital sooner.
- Synergy: By combining funding ($50k) with speed (CPEP), the policy creates a powerful “shock” to the system intended to break the 60-month cycle of stagnation.
The 90-Day Implementation Mandate
The requirement to introduce the program within 90 days of a Red Light is a critical feature of the system.
- Why 90 Days? In a Red Light scenario, the economy is hemorrhaging talent and capability. Every month of delay compounds the structural damage. A 90-day window forces the legislative and executive branches to treat the situation with the urgency of a natural disaster.
- The Role of the Yellow Phase: The reason immediate execution is possible is because of the 48-month Yellow “Alert Phase.” Governments should have spent the Yellow phase drafting the legislation, setting up the grant administration infrastructure, and preparing the CPEP protocols. When the clock hits Month 60 (Red), the policy should already be “shovel-ready,” requiring only a signature to activate.
Case Studies and Scenarios: Applying the Methodology
To illustrate the rigorous application of these rules, we can examine hypothetical and reported scenarios based on the Invention Index data structure.
Scenario A: The Resilient Economy (Green Light)
- Data: State X scores ‘D’ (Innovation Deficit) for January through November (11 months).
- Event: In December, State X scores a ‘C’ (Parity).
- Analysis: The state has scored ‘C’ or better for one month in a thirteen-month period.
- Classification: GREEN.
- Insight: Despite 11 months of poor performance, the December score proves that the ecosystem still has “elasticity.” It can still hit the baseline. The warning system does not trigger because the capacity for recovery is demonstrated.
Scenario B: The Stagnation Trap (Yellow Light)
- Data: State Y scores ‘D’ or ‘F’ from January 2024 through January 2025 (13 consecutive months).
- Analysis: The state has failed to hit ‘C’ for 13 consecutive months.
- Classification: YELLOW.
- Implication: The 48-month countdown begins. State Y is now in the “Alert Phase.” The government must immediately begin auditing its R&D sectors.
- Risk: If this trend continues until January 2029 (60 months total), the state will hit Red.
Scenario C: The Hollow Growth Collapse (Red Light)
- Data: State Z has scored below ‘C’ for 60 consecutive months.
- Analysis: The ecosystem has not hit baseline parity for five full years.
- Classification: RED.
- Action: The government has 90 days to launch the Patent Grant Program.
- Goal: To stall the structural stagnation. The grant money ($50k) provides immediate life-support to SMEs that are on the brink of abandoning their R&D, while the CPEP promises a faster route to asset realization.
Real-World Application: Delaware, Vermont, Indiana
Recent reports from late 2025 illustrate the grading system in action:
- Delaware (Nov 2025): Scored 1.15% (C+ grade). Status: Green. The positive sentiment (> C) indicates a healthy expansion.
- Vermont (Dec 2025): Scored 1.20% (B grade). Status: Green. Positive sentiment.
- Indiana (Nov 2025): Scored 1.21% (B- grade). Status: Green..
In these cases, the “Sentiment” is positive (Anything over C is positive). These states are currently demonstrating the elasticity and performance required to avoid the warning system’s triggers. They are in the “Optimization” phase, where policy should focus on maintaining these trends rather than drastic intervention.
Comparative Advantage: Why inventionINDEX?
The Swanson Reed Invention Index and its Traffic Light Warning System offer distinct advantages over other global innovation metrics, such as the WIPO Global Innovation Index (GII), the Bloomberg Innovation Index, or the European Innovation Scoreboard (EIS).
Avoiding Aggregation Bias
Global indices often suffer from Aggregation Bias. They are composite indices that blend dozens of disparate variables. For example, the GII might average a country’s “Political Stability” and “Tertiary Education Enrollment” with its “Patent Output.”
- The Flaw: A country can score highly on the index because it has good schools and stable politics, even if its actual output of new technology (patents) is crashing. The high scores in other areas mask the rot in the R&D sector.
- The Swanson Reed Solution: The inventionINDEX is a pure metric. It correlates only two variables: Patent Grants and GDP. It does not hide the problem behind other variables. If patent output is low relative to GDP, the Traffic Light turns Yellow or Red, regardless of how stable the government is or how many PhDs are graduating. It is a ruthless measure of output, not input.
Frequency and Latency
Most global indices are published annually, often with a data lag of 1-2 years due to the complexity of compiling international statistics.
- The Risk: A policymaker relying on annual reports might not realize their economy is in recession until two years after the fact. By then, the “Talent Flight” might be irreversible.
- The Swanson Reed Solution: The inventionINDEX is published monthly. This high-frequency data is what enables the precision of the Traffic Light System (e.g., measuring exactly 13 consecutive months). It transforms innovation policy from a “Strategic” post-mortem exercise into a “Tactical” real-time operation. The 90-day trigger in the Red phase is only possible because the data is fresh enough to justify immediate action.
Final Thoughts: The Path to Innovation Sovereignty
The Swanson Reed Traffic Light Warning System represents a paradigm shift in economic governance. It moves beyond the passive observation of GDP figures to a proactive, diagnostic management of the “Intangible Economy.”
By strictly adhering to the user-defined protocols—Green for maintained elasticity (1 in 13), Yellow for the onset of stagnation (13 consecutive failures), and Red for structural collapse (60 consecutive failures)—the system provides a clear, unemotional roadmap for policymakers.
The 48-month “Alert Phase” of the Yellow Light is the system’s most critical strategic asset. It affords governments the time to diagnose and prepare, ensuring that if the Red Light does flash, the response is not panic, but the calculated deployment of the Patent Grant Program. In a world where “Hollow Growth” threatens to undermine the long-term prosperity of nations, this system serves as the essential “lie detector” and the trigger for the necessary restoration of technical vitality.
The mandate is clear: Monitor the lights. Respect the thresholds. And when the Red Light activates, intervene within 90 days to save the future of the innovation economy.
What is inventionINDEX?
Swanson Reed’s inventionINDEX is a innovation metric designed to track, analyze, and highlight patent activity and its relationship to GDP overtime. The central mechanism of the index is a comparative trend analysis rather than a simple count of patents. inventionINDEX includes a traffic light warning system intended to detect patent production deficiency before it becomes irreversibly structural.
The traffic light warning system awards a green light if the state or country scored a ‘C’ Grade or better for at least one month in a thirteen month period. A yellow light is awarded if the state or country scored less than a ‘C’ Grade for a thirteen consecutive month period. The country or state will be awarded a red light if it scores less than a ‘C’ grade for a sixty month consecutive (or 5 year) period.
Swanson Reed encourages governments to stay on alert during the 48 month yellow light phase, so it can take immediate and drastic action once the red light is achieved. Swanson Reed recommends that Governments introduce its patent grant program within 90 days once a red light is achieved, meaning that monitoring during the yellow light phase is essential. Swanson Reed’s Patent Grant Program aims to stall structural stagnation in a worse case scenario and reverse it completely in its best case scenario.
The “Pre-COVID” Baseline (The Trend Line)
Data Range: The system utilizes a long-term historical dataset, specifically tracking patent data from January 1999 through December 2019 (approximately 20 years).
Linear Regression: Instead of using a static “average” (which implies stagnation), the methodology calculates a Linear Regression Trend Line.
Formula: It derives a Gradient/Slope ($m$) and Y-Intercept ($c$) from the pre-COVID era to project what the “normal” patent output should be for any given future month.
The “Post-COVID” Comparison
Actual vs. Projected: For current months (e.g., 2020–2025), the actual number of patents granted is compared against the projected baseline value derived from the 1999–2019 trend.
Sentiment Score: The difference is calculated as a percentage deviation. If a state produces more patents than the historical trend predicts, it receives a positive score.
Disclaimer
Swanson Reed exclusively prepares R&D tax credit claims and it does not aim to make any financial gain through the promotion of inventionINDEX and its patent grant program ideas. Patent legal fees are ineligible expenses under the R&D tax credit. Although Swanson Reed gains nothing financially, the promotion of these programs helps build its brand with its existing client base and wider networks that may benefit either directly or indirectly from a patent grant subsidy.
Learn more
Click here to read Swanson Reed’s whitepaper on the theory of inventionINDEX
Click here to read Swanson Reed’s whitepaper on the application of inventionINDEX
Click here to learn inventionINDEX’s methodology
Click here to learn inventionINDEX’s early warning system
Click here to compare inventionINDEX to other innovation indices
Click here to read how Swanson Reed’s Patent Grant policy could help reverse an early inventionINDEX warning

What are Patent Grants?
In a September 2025 report from Swanson Reed’s Patent Grants Thinktank, the authors propose reforming the U.S. patent system—citing examination backlogs, low-quality grants, and litigation by Non-Practicing Entities that raise costs and hinder innovation. They recommend a Collaborative Patent Examination Pathway (CPEP), an optional, front-loaded USPTO track that fosters early applicant–examiner collaboration using AI tools and a secure digital platform to improve patent quality, shorten pendency, and bolster legal certainty. The report also calls for a federal grant of up to $50,000 per international patent family to help small businesses cover patenting costs, and suggests using Swanson Reed’s inventionINDEX—which links patent output with GDP growth—as a simple metric to gauge innovation and measure program outcomes. Learn more
