
December 2025: 0.92% (D+ grade)
Kentucky inventionINDEX December 2025: 0.92% (D+ grade)
The inventionINDEX measures innovation output by comparing GDP growth with patent production growth.
Anything over C grade is positive sentiment; anything under C is negative outlook/sentiment. Using that sentiment, it is possible to observe trends over time, and also compare states/countries. In doing so, we can predict which states have the best chance to recover economically from the pandemic (or any other economic incident that may occur).
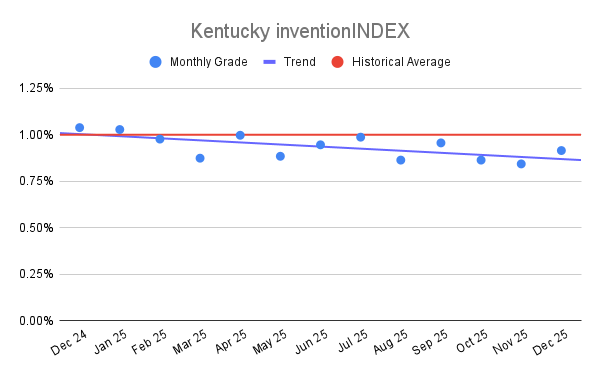
Kentucky inventionINDEX Scores – Last 12 months
| Month | inventionINDEX Score |
| December 2025 | 0.92% |
| Nov 25 | 0.84% |
| Oct 25 | 0.86% |
| Sep 25 | 0.96% |
| Aug 25 | 0.86% |
| Jul 25 | 0.99% |
| Jun 25 | 0.95% |
| May 25 | 0.88% |
| Apr 25 | 1.00% |
| Mar 25 | 0.87% |
| Feb 25 | 0.98% |
| Jan 25 | 1.03% |
| Dec 24 | 1.04% |
The inventionINDEX score for December 2025 concludes the year at 0.92 percent, earning a rating of D plus. This current standing reflects a modest recovery from the 0.84 percent low seen in November 2025, yet it remains notably lower than the performance benchmarks set in previous years. For comparison, the index stood at a more stable 1.04 percent in December 2024 and reached a much stronger 1.21 percent in December 2020. This five-year perspective reveals that while the score has fluctuated frequently, the current year-end position is trailing the more robust levels observed at the start of the sixty-month period, suggesting a period of cooling in regional innovation activity.
Achieving higher grades within this index, such as the A minus rating recorded in August 2021 with a score of 1.26 percent, yields substantial benefits for the state of Kentucky. A higher score serves as a primary indicator of a vibrant intellectual property landscape where new ideas are being successfully converted into protected assets. These peaks often coincide with periods of high investor confidence and increased support for startups and academic research. By maintaining a higher grade, the region positions itself as a leader in the knowledge economy, attracting skilled talent and high-tech industries that seek a location with a proven track record of creative output and technical sophistication.
In contrast, the negative implications of lower scores, such as the 0.82 percent F rating in April 2023 or the frequent D minus ratings throughout late 2025, present significant economic challenges. A lower inventionINDEX score typically points toward a bottleneck in the innovation pipeline, which can result from decreased investment in research and development or a lack of entrepreneurial infrastructure. Such a trend may lead to a loss of competitive advantage relative to other regions, potentially resulting in slower economic growth and fewer opportunities for high-wage employment. When the score remains in these lower brackets, it signals a need for strategic intervention or increased private-sector collaboration to revitalize the creative sectors.
A broader look at the sixty-month historical table reveals a complex narrative of growth and retraction for the Kentucky inventionINDEX. From the high-water mark of 1.26 percent in August 2021 to the challenging volatility seen in 2023 and 2024, the data underscores the sensitivity of the innovation sector to broader economic conditions. Although the latest score of 0.92 percent indicates a slight upward movement from the previous month, it is clear that the index has yet to return to the consistent C and B ranges seen earlier in the decade. Moving forward, the goal will be to leverage these historical insights to foster a more stable environment for invention, ultimately aiming to drive the score back toward the upper percentiles to ensure long-term prosperity.
Discussion:
In December, the Kentucky inventionINDEX scored a negative sentiment which was lower than the previous year’s average but outperformed the downward trend for the year. This is similar to the prior 12 months, which experienced a slight downward trend.
As the economy continues to stabilize in the post-pandemic era, it remains uncertain whether any backlog of applications still exists or if the department has returned to normal processing timelines. The inventionINDEX could also be affected by lingering consequences from the pandemic, such as company closures, reduced workforces, and limited R&D capabilities, which may still be impacting current operations.
Learn More:
Are you thinking of patenting any of your bright ideas? Did you know your research work could be eligible for the R&D Tax Credit and you can receive up to 14% back on your expenses? To find out more, please check out our free online eligibility test.
Swanson Reed’s Kentucky office provides R&D tax credit consulting and advisory services to Louisville, Lexington, Bowling Green, Owensboro, Covington, Richmond, Georgetown, Florence, Hopkinsville,and Elizabethtown.
Feel free to book a quick teleconference with one of R&D tax specialists if you would like to learn more about R&D tax credit opportunities.
Who We Are:
Swanson Reed is the largest Specialist R&D tax credit advisory firm in the United States. With offices nationwide, we are one of the only firms globally to exclusively provide R&D tax credit consulting services to our clients. We have been exclusively providing R&D tax credit claim preparation and audit compliance solutions for over 30 years.
Swanson Reed hosts daily free webinars and provides free IRS CE and CPE credits for CPAs. For more information please visit us at www.swansonreed.com/free-webinars or contact your usual Swanson Reed representative.
Are you eligible?

Why choose us?

Pass an Audit?

What is the R&D Tax Credit?
The Research & Experimentation Tax Credit (or R&D Tax Credit), is a general business tax credit under Internal Revenue Code section 41 for companies that incur research and development (R&D) costs in the United States. The credits are a tax incentive for performing qualified research in the United States, resulting in a credit to a tax return. For the first three years of R&D claims, 6% of the total qualified research expenses (QRE) form the gross credit. In the 4th year of claims and beyond, a base amount is calculated, and an adjusted expense line is multiplied times 14%. Click here to learn more.
Never miss a deadline again

Stay up to date on IRS processes

Discover R&D in your industry

R&D Tax Credit Preparation Services
Swanson Reed is one of the only companies in the United States to exclusively focus on R&D tax credit preparation. Swanson Reed provides state and federal R&D tax credit preparation and audit services to all 50 states.
If you have any questions or need further assistance, please call or email our CEO, Damian Smyth on (800) 986-4725.
Feel free to book a quick teleconference with one of our national R&D tax credit specialists at a time that is convenient for you.
R&D Tax Credit Audit Advisory Services
creditARMOR is a sophisticated R&D tax credit insurance and AI-driven risk management platform. It mitigates audit exposure by covering defense expenses, including CPA, tax attorney, and specialist consultant fees—delivering robust, compliant support for R&D credit claims. Click here for more information about R&D tax credit management and implementation.
Our Fees
Swanson Reed offers R&D tax credit preparation and audit services at our hourly rates of between $195 – $395 per hour. We are also able offer fixed fees and success fees in special circumstances. Learn more at https://www.swansonreed.com/about-us/research-tax-credit-consulting/our-fees/


Choose your state


