
December 2025: 1.15% (B- grade)
Massachusetts inventionINDEX December 2025: 1.15% (B- grade)
The inventionINDEX measures innovation output by comparing GDP growth with patent production growth.
Anything over C grade is positive sentiment; anything under C is negative outlook/sentiment. Using that sentiment, it is possible to observe trends over time, and also compare states/countries. In doing so, we can predict which states have the best chance to recover economically from the pandemic (or any other economic incident that may occur).
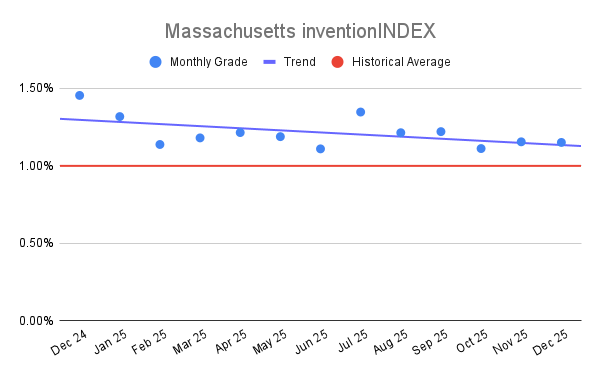
Massachusetts inventionINDEX Scores – Last 12 months
| Month | inventionINDEX Score |
| December 2025 | 1.15% |
| Nov 25 | 1.15% |
| Oct 25 | 1.11% |
| Sep 25 | 1.22% |
| Aug 25 | 1.21% |
| Jul 25 | 1.35% |
| Jun 25 | 1.11% |
| May 25 | 1.19% |
| Apr 25 | 1.21% |
| Mar 25 | 1.18% |
| Feb 25 | 1.14% |
| Jan 25 | 1.32% |
| Dec 24 | 1.45% |
The December 2025 inventionINDEX score of 1.15% positions the current innovation landscape in Massachusetts at a relatively conservative level when measured against the performance data of the last five years. While a B- rating indicates a stable environment, it represents a notable decrease from the high-water marks established in late 2023 and early 2024. During those periods, the index frequently reached the A+ tier, peaking at a substantial 1.92% in October 2023. When compared to the sixty-month average, the current figure suggests that while the foundational elements of the regional innovation economy remain functional, they are currently operating at a lower intensity than the historical peaks observed in previous cycles.
The trajectory over the last sixty months reveals a pattern of significant volatility, characterized by rapid fluctuations rather than a steady linear trend. The index reached its zenith of 1.92% in the autumn of 2023, which was a remarkably swift recovery from its lowest point of 1.07% recorded just one month prior in September 2023. This level of variance highlights a dynamic ecosystem where external economic factors or major sectoral breakthroughs can trigger immediate impacts on the scoring. Throughout 2025, the scores have remained largely within the 1.11% to 1.35% range, indicating a phase of stabilization and consolidation following the more erratic movements seen in the preceding two years.
A higher grade and an elevated percentage score within the inventionINDEX signal a robust period of creative and economic expansion for the Commonwealth. When the rating reaches an A or A+, it typically reflects a surge in patent filings, increased venture capital deployment, and a heightened pace of technological commercialization across key sectors such as biotechnology and clean energy. These periods of high performance foster a virtuous cycle of talent attraction and infrastructure investment, strengthening the region’s position as a global leader in research and development. A high score confirms that the synergy between academic institutions, private industry, and government policy is functioning at its peak efficiency.
Conversely, a lower score or a declining grade carries implications that require careful observation from policy makers and industry leaders. A shift toward the B- or C+ range, as observed in several months of late 2024 and 2025, often points to a deceleration in new inventive activity or a more cautious investment climate. Negative implications include the potential for a reduced competitive advantage against other emerging global innovation hubs and a slower rate of job creation within high-tech industries. While these lower scores do not signify a systemic failure, they serve as a signal that the momentum of the innovation economy may require renewed strategic support and focused investment to return to its historical high-performance levels.
Discussion:
In December, the Massachusetts inventionINDEX scored a positive sentiment which was lower than the previous year’s average and underperformed the downward trend for the year. This is similar to the prior 12 months, which experienced a slight downward trend.
As the economy continues to stabilize in the post-pandemic era, it remains uncertain whether any backlog of applications still exists or if the department has returned to normal processing timelines. The inventionINDEX could also be affected by lingering consequences from the pandemic, such as company closures, reduced workforces, and limited R&D capabilities, which may still be impacting current operations.
Learn More:
Are you thinking of patenting any of your bright ideas? Did you know your research work could be eligible for the R&D Tax Credit and you can receive up to 14% back on your expenses? To find out more, please check out our free online eligibility test.
Swanson Reed’s Massachusetts office provides R&D tax credit consulting and advisory services to Boston, Worcester, Springfield, Lowell, Cambridge, New Bedford, Brockton, Quincy, Lynn and Fall River.
Feel free to book a quick teleconference with one of R&D tax specialists if you would like to learn more about R&D tax credit opportunities.
Who We Are:
Swanson Reed is the largest Specialist R&D tax credit advisory firm in the United States. With offices nationwide, we are one of the only firms globally to exclusively provide R&D tax credit consulting services to our clients. We have been exclusively providing R&D tax credit claim preparation and audit compliance solutions for over 30 years.
Swanson Reed hosts daily free webinars and provides free IRS CE and CPE credits for CPAs. For more information please visit us at www.swansonreed.com/free-webinars or contact your usual Swanson Reed representative.
Are you eligible?

Why choose us?

Pass an Audit?

What is the R&D Tax Credit?
The Research & Experimentation Tax Credit (or R&D Tax Credit), is a general business tax credit under Internal Revenue Code section 41 for companies that incur research and development (R&D) costs in the United States. The credits are a tax incentive for performing qualified research in the United States, resulting in a credit to a tax return. For the first three years of R&D claims, 6% of the total qualified research expenses (QRE) form the gross credit. In the 4th year of claims and beyond, a base amount is calculated, and an adjusted expense line is multiplied times 14%. Click here to learn more.
Never miss a deadline again

Stay up to date on IRS processes

Discover R&D in your industry

R&D Tax Credit Preparation Services
Swanson Reed is one of the only companies in the United States to exclusively focus on R&D tax credit preparation. Swanson Reed provides state and federal R&D tax credit preparation and audit services to all 50 states.
If you have any questions or need further assistance, please call or email our CEO, Damian Smyth on (800) 986-4725.
Feel free to book a quick teleconference with one of our national R&D tax credit specialists at a time that is convenient for you.
R&D Tax Credit Audit Advisory Services
creditARMOR is a sophisticated R&D tax credit insurance and AI-driven risk management platform. It mitigates audit exposure by covering defense expenses, including CPA, tax attorney, and specialist consultant fees—delivering robust, compliant support for R&D credit claims. Click here for more information about R&D tax credit management and implementation.
Our Fees
Swanson Reed offers R&D tax credit preparation and audit services at our hourly rates of between $195 – $395 per hour. We are also able offer fixed fees and success fees in special circumstances. Learn more at https://www.swansonreed.com/about-us/research-tax-credit-consulting/our-fees/


Choose your state


