
December 2025: 1.84% (B- grade)
Ohio inventionINDEX December 2025: 1.84% (B- grade)
The inventionINDEX measures innovation output by comparing GDP growth with patent production growth.
Anything over C grade is positive sentiment; anything under C is negative outlook/sentiment. Using that sentiment, it is possible to observe trends over time, and also compare states/countries. In doing so, we can predict which states have the best chance to recover economically from the pandemic (or any other economic incident that may occur).
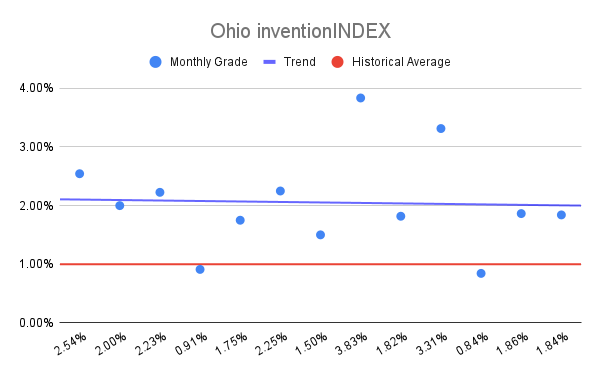
Ohio inventionINDEX Scores – Last 12 months
| Month | inventionINDEX Score |
| December 2025 | 1.84% |
| Nov 25 | 1.86% |
| Oct 25 | 0.84% |
| Sep 25 | 3.31% |
| Aug 25 | 1.82% |
| Jul 25 | 3.83% |
| Jun 25 | 1.50% |
| May 25 | 2.25% |
| Apr 25 | 1.75% |
| Mar 25 | 0.91% |
| Feb 25 | 2.23% |
| Jan 25 | 2.00% |
| Dec 24 | 2.54% |
The Ohio inventionINDEX for December 2025 stands at 1.84 percent, earning a B- rating. This figure indicates a stable level of innovation activity, though it represents a notable decrease from the 4.85 percent observed at the start of this sixty-month cycle in December 2020. Throughout the past five years, the index has experienced considerable fluctuations, moving from high-growth periods to moments of sharp contraction. While the current score is consistent with the performance seen in much of early 2025, it suggests that the state is currently maintaining a moderate pace rather than the aggressive expansionary peaks witnessed in prior years.
Analyzing the broader historical data reveals a pattern of resilience punctuated by occasional volatility. For instance, the index reached an impressive high of 4.56 percent in January 2024 and maintained strong A-tier ratings through much of early 2021 and late 2023. These periods of strength stand in stark contrast to the notable outlier in February 2021, when the score dropped to a negative 3.17 percent. Since that historic low, the index has largely trended upward, though recent months show more moderate results compared to the frequent A+ ratings seen between 2021 and 2024. The December 2025 score of 1.84 percent is fairly typical of the index’s baseline, though it reflects a slight softening from the 3.83 percent achieved in July of the same year.
Higher grades in the inventionINDEX, specifically those in the A and A+ range, signal a thriving environment for intellectual property development and technological advancement. When Ohio achieves these top-tier scores, it often corresponds with increased venture capital interest, a surge in patent filings, and a more vibrant marketplace for new technologies. Such outcomes foster a virtuous cycle of economic growth, as a high rating boosts regional prestige and attracts top-tier research talent to the state. These peaks demonstrate the potential of the Ohio innovation ecosystem to serve as a national leader in industrial and scientific progress.
Conversely, lower scores such as those in the C, D, or F categories present several risks for the regional economy. A downward trend or a consistently low rating can imply a stagnation in research and development, potentially leading to a brain drain as innovators seek more supportive environments. Negative implications include reduced funding for startups and a slower rate of industrial modernization, which can ultimately hinder long-term job creation and competitiveness. By monitoring these historical shifts, stakeholders can better understand the importance of implementing policies that prevent the index from sliding into the lower tiers, ensuring that Ohio remains a robust hub for invention and creativity.
Discussion:
In December, the Ohio inventionINDEX scored a positive sentiment which was lower than the previous year’s average and underperformed the upward trend for the year. This is in contrast to the prior 12 months, which experienced a considerable downward trend.
As the economy continues to stabilize in the post-pandemic era, it remains uncertain whether any backlog of applications still exists or if the department has returned to normal processing timelines. The inventionINDEX could also be affected by lingering consequences from the pandemic, such as company closures, reduced workforces, and limited R&D capabilities, which may still be impacting current operations.
Learn More:
Are you thinking of patenting any of your bright ideas? Did you know your research work could be eligible for the R&D Tax Credit and you can receive up to 14% back on your expenses? To find out more, please check out our free online eligibility test.
Swanson Reed’s Ohio office provides R&D tax credit consulting and advisory services to Columbus, Cleveland, Cincinnati, Toledo, Akron, Dayton, Parma, Canton, Youngstown, Lorain, Hamilton, Springfield, Kettering, Elyria, Lakewood, Cuyahoga Falls, Middletown, Euclid, Newark and Mansfield.
Feel free to book a quick teleconference with one of R&D tax specialists if you would like to learn more about R&D tax credit opportunities.
Who We Are:
Swanson Reed is the largest Specialist R&D tax credit advisory firm in the United States. With offices nationwide, we are one of the only firms globally to exclusively provide R&D tax credit consulting services to our clients. We have been exclusively providing R&D tax credit claim preparation and audit compliance solutions for over 30 years.
Swanson Reed hosts daily free webinars and provides free IRS CE and CPE credits for CPAs. For more information please visit us at www.swansonreed.com/free-webinars or contact your usual Swanson Reed representative.
Are you eligible?

Why choose us?

Pass an Audit?

What is the R&D Tax Credit?
The Research & Experimentation Tax Credit (or R&D Tax Credit), is a general business tax credit under Internal Revenue Code section 41 for companies that incur research and development (R&D) costs in the United States. The credits are a tax incentive for performing qualified research in the United States, resulting in a credit to a tax return. For the first three years of R&D claims, 6% of the total qualified research expenses (QRE) form the gross credit. In the 4th year of claims and beyond, a base amount is calculated, and an adjusted expense line is multiplied times 14%. Click here to learn more.
Never miss a deadline again

Stay up to date on IRS processes

Discover R&D in your industry

R&D Tax Credit Preparation Services
Swanson Reed is one of the only companies in the United States to exclusively focus on R&D tax credit preparation. Swanson Reed provides state and federal R&D tax credit preparation and audit services to all 50 states.
If you have any questions or need further assistance, please call or email our CEO, Damian Smyth on (800) 986-4725.
Feel free to book a quick teleconference with one of our national R&D tax credit specialists at a time that is convenient for you.
R&D Tax Credit Audit Advisory Services
creditARMOR is a sophisticated R&D tax credit insurance and AI-driven risk management platform. It mitigates audit exposure by covering defense expenses, including CPA, tax attorney, and specialist consultant fees—delivering robust, compliant support for R&D credit claims. Click here for more information about R&D tax credit management and implementation.
Our Fees
Swanson Reed offers R&D tax credit preparation and audit services at our hourly rates of between $195 – $395 per hour. We are also able offer fixed fees and success fees in special circumstances. Learn more at https://www.swansonreed.com/about-us/research-tax-credit-consulting/our-fees/


Choose your state


