VERMONT INVENTIONINDEX | DECEMBER 2025
December 2025: 1.20% (B grade)
Vermont inventionINDEX December 2025: 1.20% (B grade)
The inventionINDEX measures innovation output by comparing GDP growth with patent production growth.
Anything over C grade is positive sentiment; anything under C is negative outlook/sentiment. Using that sentiment, it is possible to observe trends over time, and also compare states/countries. In doing so, we can predict which states have the best chance to recover economically from the pandemic (or any other economic incident that may occur).
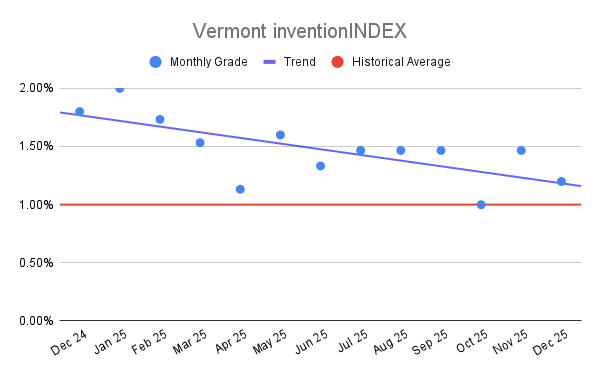
Vermont inventionINDEX Scores – Last 12 months
| Month | inventionINDEX Score |
| December 2025 | 1.20% |
| Nov 25 | 1.47% |
| Oct 25 | 1.00% |
| Sep 25 | 1.47% |
| Aug 25 | 1.47% |
| Jul 25 | 1.47% |
| Jun 25 | 1.33% |
| May 25 | 1.60% |
| Apr 25 | 1.13% |
| Mar 25 | 1.53% |
| Feb 25 | 1.73% |
| Jan 25 | 2.00% |
| Dec 24 | 1.80% |
The December 2025 Vermont inventionINDEX score of 1.20 percent, resulting in a B rating, reflects a moderate cooling compared to the preceding month of November, which held a robust A+ rating at 1.47 percent. While this recent figure represents a decline from the high-performing streaks seen throughout much of 2024 and 2025, it remains significantly above the historic floor of 0.60 percent recorded in late 2022. This shift suggests a transitional phase for regional innovation, as the index retreats from the top-tier rankings into a more middle-ground territory that requires careful observation to determine if a new trend is emerging.
Higher grades within this index, such as the peak of 3.00 percent achieved in February 2023, signal a thriving environment for creativity and commercialization. When the score ascends into the A+ range, it typically correlates with increased patent activity, higher levels of venture capital engagement, and a generally optimistic outlook for the local economy. These periods of high scores provide the necessary momentum to sustain long-term research and development projects, as stakeholders feel more confident in the return on their intellectual investments. Consequently, a higher grade serves as a powerful indicator of a resilient and forward-thinking marketplace.
Conversely, a descent into lower ratings, such as the C- and D- grades witnessed sporadically over the last five years, highlights potential vulnerabilities in the innovation pipeline. Lower scores, like the 0.80 percent seen in November 2024 or the 0.60 percent in September 2022, can imply a stagnation in new ideas or a lack of resources for regional inventors. Such dips often suggest that external economic pressures or internal policy shifts may be hindering the ability of creators to bring their projects to fruition. Persistent low ratings risk discouraging upcoming talent and could lead to a migration of intellectual property to more supportive environments.
Over the cumulative sixty-month period, the Vermont inventionINDEX has demonstrated considerable volatility, moving between extremes but frequently settling in the 1.40 to 1.60 percent range. The current 1.20 percent score sits slightly below this historical median, yet it maintains a position far healthier than the lows of 2021 and 2022. Navigating the future will depend on stabilizing these fluctuations and reclaiming the A+ status that characterized much of 2023 and 2024. By understanding the historical context of these scores, leaders can better implement strategies that foster consistent growth and minimize the frequency of significant downturns.
Discussion:
In December, the Vermont inventionINDEX scored a positive sentiment which was lower than the previous year’s average but outperformed the downward trend for the year. This is similar to the prior 12 months, which experienced a downward trend.
As the economy continues to stabilize in the post-pandemic era, it remains uncertain whether any backlog of applications still exists or if the department has returned to normal processing timelines. The inventionINDEX could also be affected by lingering consequences from the pandemic, such as company closures, reduced workforces, and limited R&D capabilities, which may still be impacting current operations.
Learn More:
Are you thinking of patenting any of your bright ideas? Did you know your research work could be eligible for the R&D Tax Credit and you can receive up to 14% back on your expenses? To find out more, please check out our free online eligibility test.
Swanson Reed’s Vermont office provides R&D tax credit consulting and advisory services to Burlington, South Burlington, Rutland, Barre, and Montpelier.
Feel free to book a quick teleconference with one of R&D tax specialists if you would like to learn more about R&D tax credit opportunities.
Who We Are:
Swanson Reed is the largest Specialist R&D tax credit advisory firm in the United States. With offices nationwide, we are one of the only firms globally to exclusively provide R&D tax credit consulting services to our clients. We have been exclusively providing R&D tax credit claim preparation and audit compliance solutions for over 30 years.
Swanson Reed hosts daily free webinars and provides free IRS CE and CPE credits for CPAs. For more information please visit us at www.swansonreed.com/free-webinars or contact your usual Swanson Reed representative.
Are you eligible?

Why choose us?

Pass an Audit?

What is the R&D Tax Credit?
The Research & Experimentation Tax Credit (or R&D Tax Credit), is a general business tax credit under Internal Revenue Code section 41 for companies that incur research and development (R&D) costs in the United States. The credits are a tax incentive for performing qualified research in the United States, resulting in a credit to a tax return. For the first three years of R&D claims, 6% of the total qualified research expenses (QRE) form the gross credit. In the 4th year of claims and beyond, a base amount is calculated, and an adjusted expense line is multiplied times 14%. Click here to learn more.
Never miss a deadline again

Stay up to date on IRS processes

Discover R&D in your industry

R&D Tax Credit Preparation Services
Swanson Reed is one of the only companies in the United States to exclusively focus on R&D tax credit preparation. Swanson Reed provides state and federal R&D tax credit preparation and audit services to all 50 states.
If you have any questions or need further assistance, please call or email our CEO, Damian Smyth on (800) 986-4725.
Feel free to book a quick teleconference with one of our national R&D tax credit specialists at a time that is convenient for you.
R&D Tax Credit Audit Advisory Services
creditARMOR is a sophisticated R&D tax credit insurance and AI-driven risk management platform. It mitigates audit exposure by covering defense expenses, including CPA, tax attorney, and specialist consultant fees—delivering robust, compliant support for R&D credit claims. Click here for more information about R&D tax credit management and implementation.
Our Fees
Swanson Reed offers R&D tax credit preparation and audit services at our hourly rates of between $195 – $395 per hour. We are also able offer fixed fees and success fees in special circumstances. Learn more at https://www.swansonreed.com/about-us/research-tax-credit-consulting/our-fees/


Choose your state