May 2026: 1.13% (B- grade)
Vermont inventionINDEX May 2026: 1.13% (B- grade)
The inventionINDEX measures innovation output by comparing GDP growth with patent production growth.
Anything over C grade is positive sentiment; anything under C is negative outlook/sentiment. Using that sentiment, it is possible to observe trends over time, and also compare states/countries. In doing so, we can predict which states have the best chance to recover economically from the pandemic (or any other economic incident that may occur).
Historical Vermont inventionINDEX Scores
The inventionINDEX score for Vermont for the past 12 months is shown in the table below.
| Month | inventionINDEX SCORE |
|---|---|
| May 2026 | 1.13% |
| April 2026 | 1.20% |
| March 2026 | 1.13% |
| February 2026 | 1.00% |
| January 2026 | 1.27% |
| December 2025 | 1.20% |
| November 2025 | 1.47% |
| October 2025 | 1.00% |
| September 2025 | 1.47% |
| August 2025 | 1.47% |
| July 2025 | 1.47% |
| June 2025 | 1.33% |
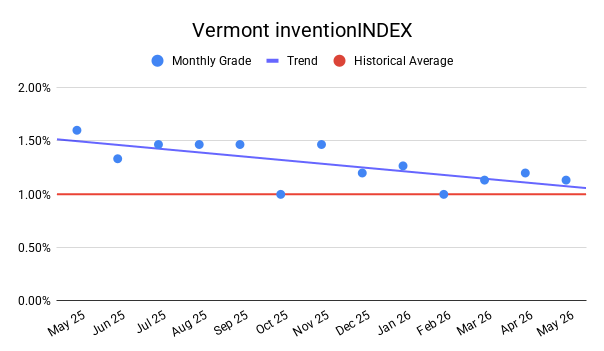
| May 2025 | 1.60% |
The Vermont inventionINDEX score for May 2026 settled at 1.13% with a B- rating, reflecting a period of relative stabilization after a volatile opening to the year. This current score matches the March 2026 metric exactly, though it marks a minor deceleration from the 1.20% recorded in April. When viewed against the broader trajectory of the past six months, the index shows a clear improvement from the winter low of 1.00% in February 2026, yet it remains below the stronger 1.27% performance witnessed in January 2026. This indicates that while the immediate downward pressure from earlier in the quarter has eased, the regional innovation ecosystem is navigating a phase of cautious equilibrium rather than aggressive expansion.
Putting the current 1.13% into a broader five-year historical context reveals significant shifts in performance over the sixty-month horizon. The current score sits well below the historical peak of 3.00% achieved in February 2023, as well as the sustained periods of high performance throughout late 2023 and mid-2024, where scores consistently hovered above the 1.50% mark with top-tier ratings. However, the current standing is notably superior to the historical baseline floor of 0.60% recorded in September 2022, which resulted in a failing grade. This long-term view demonstrates that the index is highly cyclical, and the mid-range performance of mid-2026 highlights a mature market resetting after previous historic surges.
Achieving a higher grade on the index, such as the exemplary A+ streaks observed throughout much of 2023 and 2024, yields substantial positive macroeconomic outcomes. An elevated score serves as a powerful indicator of a thriving entrepreneurial infrastructure, robust intellectual property generation, and an efficient conversion of research into commercial applications. These higher tiers enhance regional competitiveness, drawing substantial venture capital, fostering high-tech job creation, and boosting corporate investment. When the ecosystem functions at this premium level, it creates a compounding benefit where talent and funding naturally migrate toward the proven hub of high-output innovation.
Conversely, a lower score and compressed grade carry serious negative implications for the economic landscape. Drifts into the lower tiers, as seen during the sub-one-percent contractions of late 2021 and late 2024, point to underlying friction such as capital constraints, regulatory bottlenecks, or a decline in high-value patent filings. These depressed metrics can erode investor confidence, slow down institutional funding, and cause a stagnation in the development of disruptive technologies. Ultimately, prolonged dips threaten to compromise long-term productivity and place the region at a distinct disadvantage compared to more aggressive technological ecosystems.
Discussion:
In May, the Vermont inventionINDEX scored a positive sentiment which was lower than the previous year’s average but outperformed the downward trend for the year. This is similar to the prior 12 months, which experienced a slight downward trend.
As the economy continues to stabilize in the post-pandemic era, it remains uncertain whether any backlog of applications still exists or if the department has returned to normal processing timelines. The inventionINDEX could also be affected by lingering consequences from the pandemic, such as company closures, reduced workforces, and limited R&D capabilities, which may still be impacting current operations.
Learn More:
Are you thinking of patenting any of your bright ideas? Did you know your research work could be eligible for the R&D Tax Credit and you can receive up to 14% back on your expenses? To find out more, please check out our free online eligibility test.
Swanson Reed’s Vermont office provides R&D tax credit consulting and advisory services to Burlington, South Burlington, Rutland, Barre and Montpelier
Feel free to book a quick teleconference with one of R&D tax specialists if you would like to learn more about R&D tax credit opportunities.
Who We Are:
Swanson Reed is the largest Specialist R&D tax credit advisory firm in the United States. With offices nationwide, we are one of the only firms globally to exclusively provide R&D tax credit consulting services to our clients. We have been exclusively providing R&D tax credit claim preparation and audit compliance solutions for over 30 years.
Swanson Reed hosts daily free webinars and provides free IRS CE and CPE credits for CPAs. For more information please visit us at www.swansonreed.com/free-webinars or contact your usual Swanson Reed representative.