inventionINDEX: Tracking the Innovation Economy
Authors: Adam Rogers & Cherie Jones | Published: March 14, 2026
Answer Capsule: What is inventionINDEX?
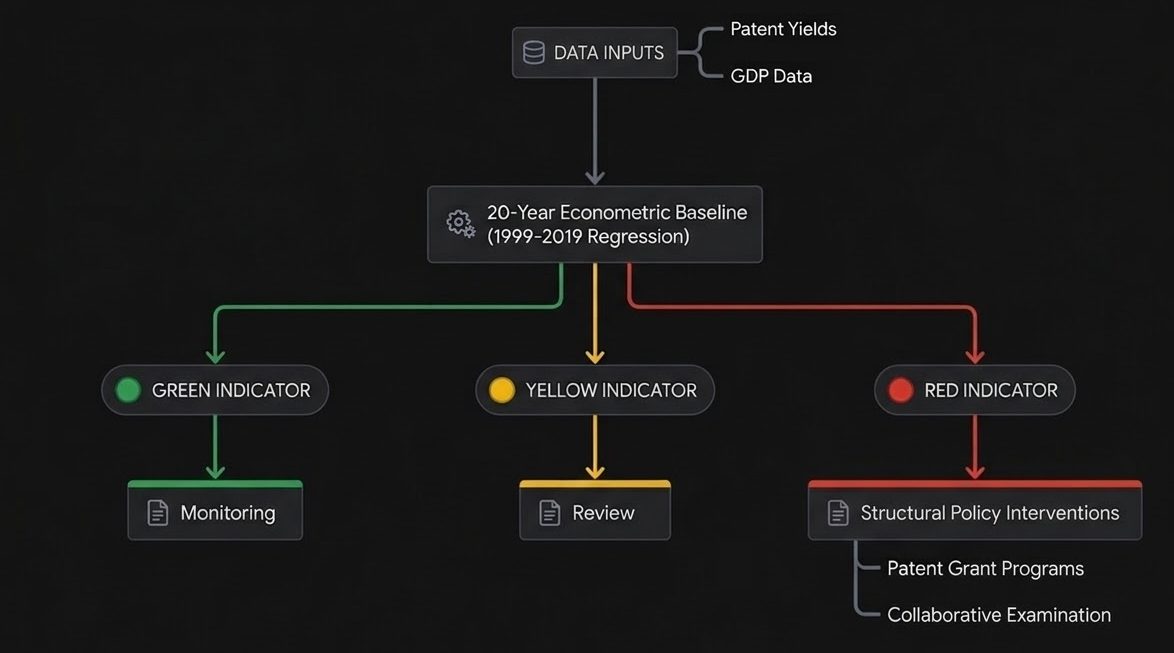
The Swanson Reed inventionINDEX is a proprietary macroeconomic tracking tool designed to measure the health and trajectory of the global innovation economy. By aggregating and analyzing raw data from international patent offices and correlating it with regional Gross Domestic Product (GDP) metrics, inventionINDEX provides corporate leaders, policymakers, and economists with unparalleled insights into technological advancement. Because Swanson Reed specializes in R&D incentives, this index serves as a foundational data asset, demonstrating the direct, quantifiable link between corporate investments in technical research and broader economic prosperity.
Key Takeaways
- Data-Driven Innovation: We track patent filing volumes across multiple jurisdictions to identify emerging technological trends before they hit the mainstream market.
- Economic Correlation: The Index provides quantitative models showing how robust intellectual property (IP) development directly fuels GDP growth.
- Strategic Benchmarking: Corporate R&D directors utilize our findings to benchmark their own innovation output against broader industry and geographic averages.
inventionINDEX Core Analytics
| Data Metric | Analysis Focus | Business Application |
|---|---|---|
| Patent Volume Trends | Tracking the total number of approved utility and design patents year-over-year. | Helps companies gauge overall market saturation and the pace of sector-specific technological disruption. |
| GDP vs. IP Correlation | Measuring how increases in a nation’s patent production impact its economic output. | Provides macroeconomic context for CFOs securing R&D budgets and forecasting long-term growth. |
| Jurisdictional Heatmaps | Analyzing which states and countries are producing the highest density of new innovations. | Assists businesses in choosing prime locations for expanding engineering teams or R&D facilities. |
Why We Measure the Innovation Economy
In a rapidly evolving global marketplace, standing still is equivalent to falling behind. Swanson Reed’s inventionINDEX was created to give our clients a quantifiable look at the future of technology and the macro forces driving their respective industries.
| Strategic Focus | inventionINDEX Insight |
|---|---|
| Patents as a Leading Economic Indicator | Traditional economic metrics often measure past performance. By contrast, patent filings are a forward-looking indicator. Because it takes years and significant capital to develop a patentable technology, a surge in patent approvals within a specific sector (such as artificial intelligence or advanced biotechnology) indicates a massive upcoming shift in commercial markets. inventionINDEX tracks these surges, allowing businesses to anticipate disruption. |
| The Link Between R&D Spend and GDP | Our research consistently demonstrates a highly correlated relationship between a nation’s investment in Research and Development and its Gross Domestic Product. Countries and states that incentivize corporate innovation through mechanisms like the R&D Tax Credit inevitably see higher volumes of high-value patents, which in turn drives high-wage job creation and economic resilience. inventionINDEX models this data to advocate for continued government investment in technical tax incentives. |
| Leveraging Data for Corporate Strategy | Beyond macroeconomic theory, inventionINDEX is a practical tool for corporate governance. Board members and Chief Technology Officers utilize our periodic reports to benchmark their internal R&D output. By comparing their company’s intellectual property generation against the broader market trends tracked in the Index, organizations can validate their R&D expenditures and ensure they are maximizing their associated tax credit claims. |
Explore the inventionINDEX Directory
Navigate our specialized macroeconomic research, regional data, and policy insights below:
| Resource Area | Description |
|---|---|
| State Innovation Data | Explore state-by-state patent production and GDP correlation to identify America’s leading regional innovation hubs and tech centers. |
| Research Whitepapers | Download our comprehensive macroeconomic whitepapers detailing the long-term economic impacts of technical research and R&D tax incentives. |
| Patent Grants Think Tank | Access policy analysis, macroeconomic forecasts, and thought leadership from the Swanson Reed Think Tank on global intellectual property trends. |