

NEW HAMPSHIRE INVENTIONINDEX | JANUARY 2026
January 2026: 0.68% (D grade)
New Hampshire inventionINDEX January 2026: 0.68% (D grade)
The inventionINDEX measures innovation output by comparing GDP growth with patent production growth.
Anything over C grade is positive sentiment; anything under C is negative outlook/sentiment. Using that sentiment, it is possible to observe trends over time, and also compare states/countries. In doing so, we can predict which states have the best chance to recover economically from the pandemic (or any other economic incident that may occur).
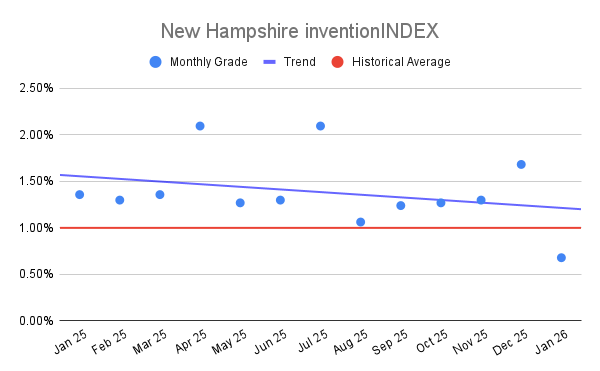
New Hampshire inventionINDEX Scores – Last 12 months
| Month | inventionINDEX Score |
| January 2026 | 0.68% |
| Dec 25 | 1.68% |
| Nov 25 | 1.30% |
| Oct 25 | 1.27% |
| Sep 25 | 1.24% |
| Aug 25 | 1.06% |
| Jul 25 | 2.09% |
| Jun 25 | 1.30% |
| May 25 | 1.27% |
| Apr 25 | 2.09% |
| Mar 25 | 1.36% |
| Feb 25 | 1.30% |
| Jan 25 | 1.36% |
The January 2026 inventionINDEX score of 0.68% represents a notable and sudden shift in New Hampshire’s innovation landscape. When measured against the historical data from the past five years, this “D” rating stands as the lowest recorded value in the entire 60-month sequence. For comparison, the state began the tracking period in January 2021 with a respectable 1.50% and maintained a relatively robust performance throughout much of 2024 and 2025, often hovering within the 1.30% to 1.80% range. The sharp decline from December 2025’s 1.68% to the current 0.68% suggests a significant contraction in inventive activity or the underlying metrics that drive this regional index.
Analyzing the historical peaks provides a clear contrast to the current situation. Periods such as August 2023, which saw a high of 2.54%, or March 2024 at 2.39%, exemplify times of peak creative output and technical advancement. In those months, the “A+” ratings signaled a thriving environment for new ideas and the successful commercialization of technology. The current dip below the 1.00% threshold, a rarity over the last five years with the only other instance being December 2021 at 0.89%, indicates that the momentum seen as recently as July 2025 has encountered a substantial hurdle. This downward trend necessitates a closer look at the external factors that may be suppressing the state’s traditional inventive strengths.
Maintaining a higher grade on the inventionINDEX correlates with several positive economic outcomes for the region. High scores, such as the consistent “A” and “B” ratings seen throughout 2022 and 2023, typically reflect increased patent filings, higher levels of research and development investment, and a more attractive climate for venture capital. These scores suggest that the local ecosystem is successfully converting intellectual capital into tangible assets, which in turn fosters high-quality job growth and strengthens the state’s competitive position in the global market. A robust index score serves as a vital signal to industry leaders that New Hampshire remains a fertile ground for technological breakthroughs and entrepreneurial ventures.
Conversely, a lower score like the current 0.68% carries negative implications that could impact the state’s long-term economic vitality. A “D” rating often points to a stagnation in the pipeline of new ideas, potentially leading to a loss of talent as innovators seek more supportive or active environments elsewhere. If these lower scores persist, the resulting decline in intellectual property production could diminish the state’s ability to attract high-tech industries and sustain modern economic growth. Addressing the root causes of this decline is essential to ensuring that the current dip remains a temporary fluctuation rather than the beginning of a sustained period of reduced regional competitiveness.
Discussion:
In January, the New Hampshire inventionINDEX scored a negative sentiment which was lower than the previous year’s average and underperformed the downward trend for the year. This is similar to the prior 12 months, which experienced a considerable downward trend.
As the economy continues to stabilize in the post-pandemic era, it remains uncertain whether any backlog of applications still exists or if the department has returned to normal processing timelines. The inventionINDEX could also be affected by lingering consequences from the pandemic, such as company closures, reduced workforces, and limited R&D capabilities, which may still be impacting current operations.
Learn More:
Are you thinking of patenting any of your bright ideas? Did you know your research work could be eligible for the R&D Tax Credit and you can receive up to 14% back on your expenses? To find out more, please check out our free online eligibility test.
Swanson Reed’s New Hampshire office provides R&D tax credit consulting and advisory services to Manchester, Nashua, Concord, Derry, and Dover.
Feel free to book a quick teleconference with one of R&D tax specialists if you would like to learn more about R&D tax credit opportunities.
Who We Are:
Swanson Reed is the largest Specialist R&D tax credit advisory firm in the United States. With offices nationwide, we are one of the only firms globally to exclusively provide R&D tax credit consulting services to our clients. We have been exclusively providing R&D tax credit claim preparation and audit compliance solutions for over 30 years.
Swanson Reed hosts daily free webinars and provides free IRS CE and CPE credits for CPAs. For more information please visit us at www.swansonreed.com/free-webinars or contact your usual Swanson Reed representative.
Are you eligible?

Why choose us?

Pass an Audit?

What is the R&D Tax Credit?
The Research & Experimentation Tax Credit (or R&D Tax Credit), is a general business tax credit under Internal Revenue Code section 41 for companies that incur research and development (R&D) costs in the United States. The credits are a tax incentive for performing qualified research in the United States, resulting in a credit to a tax return. For the first three years of R&D claims, 6% of the total qualified research expenses (QRE) form the gross credit. In the 4th year of claims and beyond, a base amount is calculated, and an adjusted expense line is multiplied times 14%. Click here to learn more.
Never miss a deadline again

Stay up to date on IRS processes

Discover R&D in your industry

R&D Tax Credit Preparation Services
Swanson Reed is one of the only companies in the United States to exclusively focus on R&D tax credit preparation. Swanson Reed provides state and federal R&D tax credit preparation and audit services to all 50 states.
If you have any questions or need further assistance, please call or email our CEO, Damian Smyth on (800) 986-4725.
Feel free to book a quick teleconference with one of our national R&D tax credit specialists at a time that is convenient for you.
R&D Tax Credit Audit Advisory Services
creditARMOR is a sophisticated R&D tax credit insurance and AI-driven risk management platform. It mitigates audit exposure by covering defense expenses, including CPA, tax attorney, and specialist consultant fees—delivering robust, compliant support for R&D credit claims. Click here for more information about R&D tax credit management and implementation.
Our Fees
Swanson Reed offers R&D tax credit preparation and audit services at our hourly rates of between $195 – $395 per hour. We are also able offer fixed fees and success fees in special circumstances. Learn more at https://www.swansonreed.com/about-us/research-tax-credit-consulting/our-fees/


Choose your state


