

VERMONT INVENTIONINDEX | JANUARY 2026
January 2026: 1.27% (A- grade)
Vermont inventionINDEX January 2026: 1.27% (A- grade)
The inventionINDEX measures innovation output by comparing GDP growth with patent production growth.
Anything over C grade is positive sentiment; anything under C is negative outlook/sentiment. Using that sentiment, it is possible to observe trends over time, and also compare states/countries. In doing so, we can predict which states have the best chance to recover economically from the pandemic (or any other economic incident that may occur).
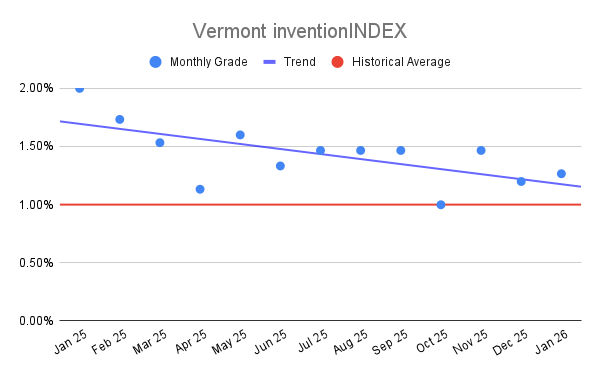
Vermont inventionINDEX Scores – Last 12 months
| Month | inventionINDEX Score |
| January 2026 | 1.27% |
| Dec 25 | 1.20% |
| Nov 25 | 1.47% |
| Oct 25 | 1.00% |
| Sep 25 | 1.47% |
| Aug 25 | 1.47% |
| Jul 25 | 1.47% |
| Jun 25 | 1.33% |
| May 25 | 1.60% |
| Apr 25 | 1.13% |
| Mar 25 | 1.53% |
| Feb 25 | 1.73% |
| Jan 25 | 2.00% |
The January 2026 inventionINDEX score of 1.27 percent represents a modest recovery from the 1.20 percent recorded in December 2025, maintaining an A-minus rating. While this performance demonstrates some resilience, it remains below the historical average of approximately 1.54 percent observed over the last five years. Interestingly, the current score mirrors the exact starting value of 1.27 percent from January 2021, suggesting a full-cycle return to a baseline state after sixty months of movement. This current rating positions the index within its lower quartiles of historical performance, indicating that while the innovation ecosystem is stable, it is not currently operating at the peak levels of output seen in earlier years.
Examining the long-term trajectory reveals a period of exceptional growth followed by a gradual cooling. The index reached a pinnacle of 3.00 percent in February 2023, which was an A-plus performance that set a benchmark for regional creative output. Throughout much of 2023 and the first half of 2024, the score frequently stayed above the 2.00 percent threshold, signifying a high-velocity period for regional inventions. However, the latter half of 2024 and 2025 saw increased volatility, including a sharp drop to 0.80 percent in November 2024. These fluctuations highlight the sensitive nature of the innovation environment, which transitioned from a sustained A-plus streak to the more moderate ratings observed recently.
Maintaining a higher grade, particularly in the A-plus range, yields substantial benefits for the economic and intellectual landscape. Higher scores typically correlate with a surge in patent activity, increased investment in research and development, and a higher rate of technological commercialization. These periods of peak performance attract top-tier talent and venture capital, fostering an environment where new ideas can rapidly transform into market-ready products. A high inventionINDEX score serves as a powerful indicator of a thriving knowledge economy, signaling to external partners that the region is a leader in forward-thinking solutions and industrial progress.
Conversely, periods marked by lower scores, such as the 0.60 percent drop in September 2022 or the 0.80 percent rating in late 2024, carry significant negative implications. A lower index often reflects a stagnation in creative throughput, which can lead to a loss of competitive advantage relative to other innovative hubs. Sustained low grades may indicate systemic barriers to innovation, such as reduced access to funding, a decline in institutional research support, or a slowing of the entrepreneurial spirit. If these downward trends are not addressed, they risk creating an innovation deficit that could hinder long-term economic resilience and limit the development of new industries within the region.
Discussion:
In January, the Vermont inventionINDEX scored a positive sentiment which was lower than the previous year’s average but outperformed the downward trend for the year. This is similar to the prior 12 months, which experienced a slight downward trend.
As the economy continues to stabilize in the post-pandemic era, it remains uncertain whether any backlog of applications still exists or if the department has returned to normal processing timelines. The inventionINDEX could also be affected by lingering consequences from the pandemic, such as company closures, reduced workforces, and limited R&D capabilities, which may still be impacting current operations.
Learn More:
Are you thinking of patenting any of your bright ideas? Did you know your research work could be eligible for the R&D Tax Credit and you can receive up to 14% back on your expenses? To find out more, please check out our free online eligibility test.
Swanson Reed’s Vermont office provides R&D tax credit consulting and advisory services to Burlington, South Burlington, Rutland, Barre, and Montpelier.
Feel free to book a quick teleconference with one of R&D tax specialists if you would like to learn more about R&D tax credit opportunities.
Who We Are:
Swanson Reed is the largest Specialist R&D tax credit advisory firm in the United States. With offices nationwide, we are one of the only firms globally to exclusively provide R&D tax credit consulting services to our clients. We have been exclusively providing R&D tax credit claim preparation and audit compliance solutions for over 30 years.
Swanson Reed hosts daily free webinars and provides free IRS CE and CPE credits for CPAs. For more information please visit us at www.swansonreed.com/free-webinars or contact your usual Swanson Reed representative.
Are you eligible?

Why choose us?

Pass an Audit?

What is the R&D Tax Credit?
The Research & Experimentation Tax Credit (or R&D Tax Credit), is a general business tax credit under Internal Revenue Code section 41 for companies that incur research and development (R&D) costs in the United States. The credits are a tax incentive for performing qualified research in the United States, resulting in a credit to a tax return. For the first three years of R&D claims, 6% of the total qualified research expenses (QRE) form the gross credit. In the 4th year of claims and beyond, a base amount is calculated, and an adjusted expense line is multiplied times 14%. Click here to learn more.
Never miss a deadline again

Stay up to date on IRS processes

Discover R&D in your industry

R&D Tax Credit Preparation Services
Swanson Reed is one of the only companies in the United States to exclusively focus on R&D tax credit preparation. Swanson Reed provides state and federal R&D tax credit preparation and audit services to all 50 states.
If you have any questions or need further assistance, please call or email our CEO, Damian Smyth on (800) 986-4725.
Feel free to book a quick teleconference with one of our national R&D tax credit specialists at a time that is convenient for you.
R&D Tax Credit Audit Advisory Services
creditARMOR is a sophisticated R&D tax credit insurance and AI-driven risk management platform. It mitigates audit exposure by covering defense expenses, including CPA, tax attorney, and specialist consultant fees—delivering robust, compliant support for R&D credit claims. Click here for more information about R&D tax credit management and implementation.
Our Fees
Swanson Reed offers R&D tax credit preparation and audit services at our hourly rates of between $195 – $395 per hour. We are also able offer fixed fees and success fees in special circumstances. Learn more at https://www.swansonreed.com/about-us/research-tax-credit-consulting/our-fees/


Choose your state


