

April 2026: 1.15% (C+ grade)
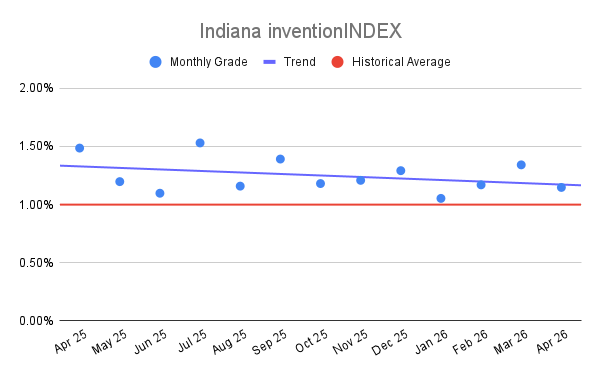
Indiana inventionINDEX April 2026: 1.15% (C+ grade)
The inventionINDEX measures innovation output by comparing GDP growth with patent production growth.
Anything over C grade is positive sentiment; anything under C is negative outlook/sentiment. Using that sentiment, it is possible to observe trends over time, and also compare states/countries. In doing so, we can predict which states have the best chance to recover economically from the pandemic (or any other economic incident that may occur).
Indiana inventionINDEX Scores – Last 12 months
| Month | inventionINDEX Score |
| April 2026 | 1.15% |
| Mar 26 | 1.34% |
| Feb 26 | 1.17% |
| Jan 26 | 1.05% |
| Dec 25 | 1.29% |
| Nov 25 | 1.21% |
| Oct 25 | 1.18% |
| Sep 25 | 1.39% |
| Aug 25 | 1.16% |
| Jul 25 | 1.53% |
| Jun 25 | 1.10% |
| May 25 | 1.20% |
| Apr 25 | 1.49% |
The Indiana inventionINDEX for April 2026 stands at 1.15 percent with a C-plus rating. This figure represents a moderate decline from the March 2026 performance of 1.34 percent. When viewed against the broader 60-month timeline, this current score resides in a relatively subdued territory compared to the historical high of 2.26 percent recorded in November 2023. While the April 2026 rating is not the absolute lowest on record, it signals a departure from the more robust B and A-minus clusters that defined much of 2021 and 2022. This suggests a phase of cooling in the state’s innovation output after a brief spike in the first quarter of the year.
Achieving a higher grade, such as the A-plus and A-minus ratings seen periodically over the last five years, yields significant advantages for the economic landscape of the state. A high index score typically reflects an environment where intellectual property development is thriving, research investments are yielding fruit, and the commercialization pipeline is efficient. These peak periods, which often exceed the 1.50 percent threshold, indicate a surge in patent filings and a heightened level of venture capital interest. Such performance reinforces the reputation of the region as a hub for advanced manufacturing and biotechnology, acting as a beacon for high-tech talent and encouraging a virtuous cycle of creative growth.
Conversely, a lower score such as the current C-plus or the C rating from January 2026 carries concerning implications for the long-term growth trajectory of the state. When the index dips toward the 1.05 percent mark, it often points to a stagnation in the discovery phase of the innovation lifecycle or a bottleneck in bringing new ideas to market. These lower ratings can lead to a reduction in investor confidence and may signal that the region is facing increased competition from neighboring areas with more aggressive innovation incentives. Persistent low scores could eventually result in talent migration, as specialized workers in science and engineering seek environments where their creative output is more readily translated into economic value.
Taking the 60-month historical view into account, the Indiana inventionINDEX reveals an ecosystem capable of reaching elite levels of productivity but currently navigating a period of consolidation. The volatility observed, specifically moving from the exceptional performance in late 2023 to the more frequent 1.10 percent to 1.30 percent range in the current year, highlights the sensitivity of the local innovation engine to shifting economic pressures. For the state to return to its high-performing historical average, it must address the underlying factors contributing to these recent C-level ratings. Moving forward, the strategic objective remains to stabilize the index in the B-plus to A-minus range to ensure the long-term vitality of the industrial base.
Discussion:
In April, the Indiana inventionINDEX scored a positive sentiment which was lower than the previous year’s average and underperformed the downward trend for the year. This is in contrast to the prior 12 months, which experienced an upward trend.
As the economy continues to stabilize in the post-pandemic era, it remains uncertain whether any backlog of applications still exists or if the department has returned to normal processing timelines. The inventionINDEX could also be affected by lingering consequences from the pandemic, such as company closures, reduced workforces, and limited R&D capabilities, which may still be impacting current operations.
Learn More:
Are you thinking of patenting any of your bright ideas? Did you know your research work could be eligible for the R&D Tax Credit and you can receive up to 14% back on your expenses? To find out more, please check out our free online eligibility test.
Swanson Reed’s Indiana office provides R&D tax credit consulting and advisory services to Indianapolis, Fort Wayne, Evansville, South Bend, Carmel, Fishers, Bloomington, Hammond, Gary and Lafayette.
Feel free to book a quick teleconference with one of R&D tax specialists if you would like to learn more about R&D tax credit opportunities.
Who We Are:
Swanson Reed is the largest Specialist R&D tax credit advisory firm in the United States. With offices nationwide, we are one of the only firms globally to exclusively provide R&D tax credit consulting services to our clients. We have been exclusively providing R&D tax credit claim preparation and audit compliance solutions for over 30 years.
Swanson Reed hosts daily free webinars and provides free IRS CE and CPE credits for CPAs. For more information please visit us at www.swansonreed.com/free-webinars or contact your usual Swanson Reed representative.
Are you eligible?

Why choose us?

Pass an Audit?

What is the R&D Tax Credit?
The Research & Experimentation Tax Credit (or R&D Tax Credit), is a general business tax credit under Internal Revenue Code section 41 for companies that incur research and development (R&D) costs in the United States. The credits are a tax incentive for performing qualified research in the United States, resulting in a credit to a tax return. For the first three years of R&D claims, 6% of the total qualified research expenses (QRE) form the gross credit. In the 4th year of claims and beyond, a base amount is calculated, and an adjusted expense line is multiplied times 14%. Click here to learn more.
Never miss a deadline again

Stay up to date on IRS processes

Discover R&D in your industry

R&D Tax Credit Preparation Services
Swanson Reed is one of the only companies in the United States to exclusively focus on R&D tax credit preparation. Swanson Reed provides state and federal R&D tax credit preparation and audit services to all 50 states.
If you have any questions or need further assistance, please call or email our CEO, Damian Smyth on (800) 986-4725.
Feel free to book a quick teleconference with one of our national R&D tax credit specialists at a time that is convenient for you.
R&D Tax Credit Audit Advisory Services
creditARMOR is a sophisticated R&D tax credit insurance and AI-driven risk management platform. It mitigates audit exposure by covering defense expenses, including CPA, tax attorney, and specialist consultant fees—delivering robust, compliant support for R&D credit claims. Click here for more information about R&D tax credit management and implementation.
Our Fees
Swanson Reed offers R&D tax credit preparation and audit services at our hourly rates of between $195 – $395 per hour. We are also able offer fixed fees and success fees in special circumstances. Learn more at https://www.swansonreed.com/about-us/research-tax-credit-consulting/our-fees/


Choose your state


