

May 2026: 1.19% (C+ grade)
Indiana inventionINDEX May 2026: 1.19% (C+ grade)
The inventionINDEX measures innovation output by comparing GDP growth with patent production growth.
Anything over C grade is positive sentiment; anything under C is negative outlook/sentiment. Using that sentiment, it is possible to observe trends over time, and also compare states/countries. In doing so, we can predict which states have the best chance to recover economically from the pandemic (or any other economic incident that may occur).
Indiana inventionINDEX Scores – Last 12 months
| Month | inventionINDEX Score |
| May 2026 | 1.19% |
| Apr 26 | 1.15% |
| Mar 26 | 1.34% |
| Feb 26 | 1.17% |
| Jan 26 | 1.05% |
| Dec 25 | 1.29% |
| Nov 25 | 1.21% |
| Oct 25 | 1.18% |
| Sep 25 | 1.39% |
| Aug 25 | 1.16% |
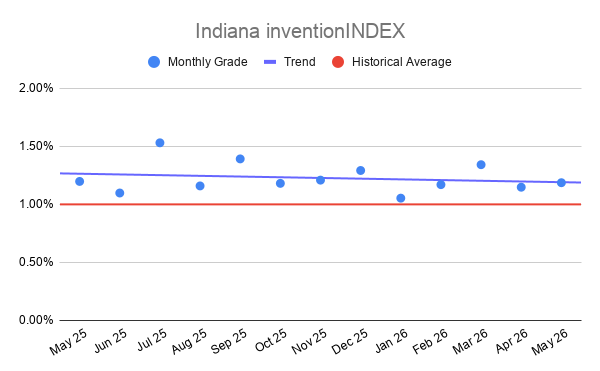
| Jul 25 | 1.53% |
| Jun 25 | 1.10% |
| May 25 | 1.20% |
The Indiana inventionINDEX for May 2026 registered at 1.19%, earning a C+ rating and indicating a slight, incremental rebound from the immediate contraction observed in the previous month. In April 2026, the index dipped to 1.15% (C+ rating), continuing a period of compressed performance that has characterized much of the current year. This minor positive shift of 0.04 percentage points shows near-term stabilization, though it remains notably softer than the year’s early peak in March 2026, when the index climbed to 1.34% to secure a solid B rating. The current tracking positions the state in a holding pattern, demonstrating resilience against a steeper decline but struggling to capture significant upward velocity.
When evaluated against the broader 60-month historical horizon, the May 2026 score highlights a clear macro-level cooling trend across the state’s innovation lifecycle. The historical data reveals that Indiana’s index has spent considerable time in the stronger B and A tiers, with the absolute peak occurring in November 2023 at an exceptional 2.26% (A+ rating). Other strong historical baselines include June 2021 at 1.69% and May 2022 at 1.61%. In contrast, the current score of 1.19% sits much closer to the historical floor of 1.05% (C rating), which was recorded in both May 2024 and January 2026. This long-term deceleration indicates that while the state has successfully avoided falling into failing parameters, its current creative and industrial output is underperforming relative to its historical averages.
Achieving higher scores and reclaiming top-tier grades within the inventionINDEX yields vital positive outcomes for Indiana’s broader economic architecture. When the index advances into the A and B brackets, it signifies a highly productive regional ecosystem characterized by intense research and development activity, rapid patent originations, and thriving entrepreneurial density. This performance serves as a powerful market signal that attracts out-of-state venture capital, encourages corporate expansions, and builds robust pipelines between private enterprises and premier research universities. Ultimately, a elevated innovation index drives high-wage job creation in technology, advanced manufacturing, and life sciences, accelerating systemic economic growth.
Conversely, lingering in lower grading tiers or experiencing sustained downward shifts carries profound negative implications for long-term economic vitality. Lower scores, such as the C-tier ratings persistent throughout early 2026, point to underlying structural bottlenecks, reduced corporate R&D expenditures, or friction in transferring intellectual property to the commercial market. If these depressed scores become a permanent trend, they risk eroding investor confidence, which can trigger capital flight to more dynamic neighboring markets. Furthermore, a stagnant innovation environment frequently leads to a localized talent drain, as top-tier engineers, scientists, and tech entrepreneurs relocate to regions with more aggressive capital deployment and market momentum.
Discussion:
In May, the Indiana inventionINDEX scored a positive sentiment which was lower than the previous year’s average but outperformed the downward trend for the year. This is in contrast to the prior 12 months, which experienced a slight upward trend.
As the economy continues to stabilize in the post-pandemic era, it remains uncertain whether any backlog of applications still exists or if the department has returned to normal processing timelines. The inventionINDEX could also be affected by lingering consequences from the pandemic, such as company closures, reduced workforces, and limited R&D capabilities, which may still be impacting current operations.
Learn More:
Are you thinking of patenting any of your bright ideas? Did you know your research work could be eligible for the R&D Tax Credit and you can receive up to 14% back on your expenses? To find out more, please check out our free online eligibility test.
Swanson Reed’s Indiana office provides R&D tax credit consulting and advisory services to Indianapolis, Fort Wayne, Evansville, South Bend, Carmel, Fishers, Bloomington, Hammond, Gary and Lafayette.
Feel free to book a quick teleconference with one of R&D tax specialists if you would like to learn more about R&D tax credit opportunities.
Who We Are:
Swanson Reed is the largest Specialist R&D tax credit advisory firm in the United States. With offices nationwide, we are one of the only firms globally to exclusively provide R&D tax credit consulting services to our clients. We have been exclusively providing R&D tax credit claim preparation and audit compliance solutions for over 30 years.
Swanson Reed hosts daily free webinars and provides free IRS CE and CPE credits for CPAs. For more information please visit us at www.swansonreed.com/free-webinars or contact your usual Swanson Reed representative.
Are you eligible?

Why choose us?

Pass an Audit?

What is the R&D Tax Credit?
The Research & Experimentation Tax Credit (or R&D Tax Credit), is a general business tax credit under Internal Revenue Code section 41 for companies that incur research and development (R&D) costs in the United States. The credits are a tax incentive for performing qualified research in the United States, resulting in a credit to a tax return. For the first three years of R&D claims, 6% of the total qualified research expenses (QRE) form the gross credit. In the 4th year of claims and beyond, a base amount is calculated, and an adjusted expense line is multiplied times 14%. Click here to learn more.
Never miss a deadline again

Stay up to date on IRS processes

Discover R&D in your industry

R&D Tax Credit Preparation Services
Swanson Reed is one of the only companies in the United States to exclusively focus on R&D tax credit preparation. Swanson Reed provides state and federal R&D tax credit preparation and audit services to all 50 states.
If you have any questions or need further assistance, please call or email our CEO, Damian Smyth on (800) 986-4725.
Feel free to book a quick teleconference with one of our national R&D tax credit specialists at a time that is convenient for you.
R&D Tax Credit Audit Advisory Services
creditARMOR is a sophisticated R&D tax credit insurance and AI-driven risk management platform. It mitigates audit exposure by covering defense expenses, including CPA, tax attorney, and specialist consultant fees—delivering robust, compliant support for R&D credit claims. Click here for more information about R&D tax credit management and implementation.
Our Fees
Swanson Reed offers R&D tax credit preparation and audit services at our hourly rates of between $195 – $395 per hour. We are also able offer fixed fees and success fees in special circumstances. Learn more at https://www.swansonreed.com/about-us/research-tax-credit-consulting/our-fees/


Choose your state


