

INDIANA INVENTIONINDEX | JANUARY 2026
January 2026: 1.05% (C grade)
Indiana inventionINDEX January 2026: 1.05% (C grade)
The inventionINDEX measures innovation output by comparing GDP growth with patent production growth.
Anything over C grade is positive sentiment; anything under C is negative outlook/sentiment. Using that sentiment, it is possible to observe trends over time, and also compare states/countries. In doing so, we can predict which states have the best chance to recover economically from the pandemic (or any other economic incident that may occur).
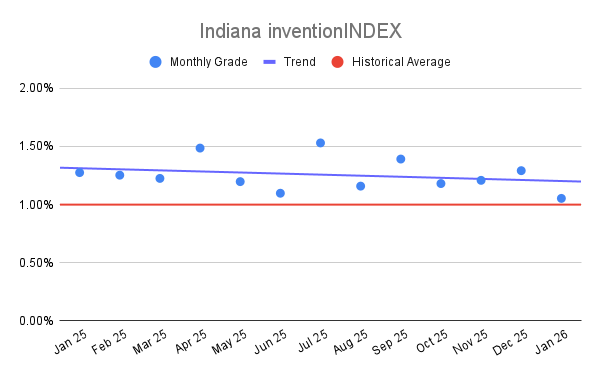
Indiana inventionINDEX Scores – Last 12 months
| Month | inventionINDEX Score |
| January 2026 | 1.05% |
| Dec 25 | 1.29% |
| Nov 25 | 1.21% |
| Oct 25 | 1.18% |
| Sep 25 | 1.39% |
| Aug 25 | 1.16% |
| Jul 25 | 1.53% |
| Jun 25 | 1.10% |
| May 25 | 1.20% |
| Apr 25 | 1.49% |
| Mar 25 | 1.23% |
| Feb 25 | 1.25% |
| Jan 25 | 1.28% |
The Indiana inventionINDEX for January 2026 reflects a score of 1.05% with a rating of C, positioning the state at its lowest performance level observed over the last sixty months. This current figure marks a notable shift from the historical peak of 2.26% achieved in November 2023. When compared to the five-year average of approximately 1.37%, the most recent data indicates a significant cooling period in regional innovation activities. Throughout the preceding five years, the index has experienced several periods of high performance, such as the 1.77% recorded in March 2021 and the 1.69% in June 2021, suggesting that the current dip is a distinct departure from the historical norm.
Attaining a higher grade on the inventionINDEX, particularly within the A or B ranges, typically signifies a robust ecosystem for research, development, and commercialization. High scores often correlate with increased patent filings, substantial venture capital investment, and the rapid expansion of technology-based startups. These periods of peak performance suggest that local industries are successfully translating intellectual property into economic value, which in turn attracts specialized talent and strengthens the overall competitiveness of the regional economy. A rating of A+ or A- serves as a compelling indicator of a thriving innovation pipeline that is capable of sustaining long-term growth and fostering high-wage job creation.
In contrast, lower scores like the current C rating carry several negative implications for the state’s economic landscape. A lower index value frequently reflects a slowdown in the generation of new ideas or a potential bottleneck in the commercialization process. Such stagnation can lead to diminished investor confidence and may prompt highly skilled researchers and entrepreneurs to seek more active environments elsewhere. If a low score persists, it serves as a warning that the infrastructure supporting innovation, including university research funding and incubator availability, may require strategic reassessment or renewed support to avoid a more permanent decline in regional ingenuity.
Ultimately, the sixty-month trajectory of the Indiana inventionINDEX illustrates a dynamic environment that has demonstrated a significant capacity for excellence despite the recent downturn. The progression from the exceptional highs of late 2021 and 2023 to the current 1.05% highlights the importance of consistent policy and private sector engagement to maintain upward momentum. While the current score necessitates careful attention, the historical data indicates that the index has the resilience to rebound after periods of contraction. By analyzing these long-term trends, stakeholders can better understand the cyclical nature of innovation and work toward restoring the higher performance levels observed in previous years.
Discussion:
In January, the Indiana inventionINDEX scored a positive sentiment which was lower than the previous year’s average and underperformed the downward trend for the year. This is in contrast to the prior 12 months, which experienced a slight upward trend.
As the economy continues to stabilize in the post-pandemic era, it remains uncertain whether any backlog of applications still exists or if the department has returned to normal processing timelines. The inventionINDEX could also be affected by lingering consequences from the pandemic, such as company closures, reduced workforces, and limited R&D capabilities, which may still be impacting current operations.
Learn More:
Are you thinking of patenting any of your bright ideas? Did you know your research work could be eligible for the R&D Tax Credit and you can receive up to 14% back on your expenses? To find out more, please check out our free online eligibility test.
Swanson Reed’s Indiana office provides R&D tax credit consulting and advisory services to Indianapolis, Fort Wayne, Evansville, South Bend, Carmel, Fishers, Bloomington, Hammond, Gary and Lafayette.
Feel free to book a quick teleconference with one of R&D tax specialists if you would like to learn more about R&D tax credit opportunities.
Who We Are:
Swanson Reed is the largest Specialist R&D tax credit advisory firm in the United States. With offices nationwide, we are one of the only firms globally to exclusively provide R&D tax credit consulting services to our clients. We have been exclusively providing R&D tax credit claim preparation and audit compliance solutions for over 30 years.
Swanson Reed hosts daily free webinars and provides free IRS CE and CPE credits for CPAs. For more information please visit us at www.swansonreed.com/free-webinars or contact your usual Swanson Reed representative.
Are you eligible?

Why choose us?

Pass an Audit?

What is the R&D Tax Credit?
The Research & Experimentation Tax Credit (or R&D Tax Credit), is a general business tax credit under Internal Revenue Code section 41 for companies that incur research and development (R&D) costs in the United States. The credits are a tax incentive for performing qualified research in the United States, resulting in a credit to a tax return. For the first three years of R&D claims, 6% of the total qualified research expenses (QRE) form the gross credit. In the 4th year of claims and beyond, a base amount is calculated, and an adjusted expense line is multiplied times 14%. Click here to learn more.
Never miss a deadline again

Stay up to date on IRS processes

Discover R&D in your industry

R&D Tax Credit Preparation Services
Swanson Reed is one of the only companies in the United States to exclusively focus on R&D tax credit preparation. Swanson Reed provides state and federal R&D tax credit preparation and audit services to all 50 states.
If you have any questions or need further assistance, please call or email our CEO, Damian Smyth on (800) 986-4725.
Feel free to book a quick teleconference with one of our national R&D tax credit specialists at a time that is convenient for you.
R&D Tax Credit Audit Advisory Services
creditARMOR is a sophisticated R&D tax credit insurance and AI-driven risk management platform. It mitigates audit exposure by covering defense expenses, including CPA, tax attorney, and specialist consultant fees—delivering robust, compliant support for R&D credit claims. Click here for more information about R&D tax credit management and implementation.
Our Fees
Swanson Reed offers R&D tax credit preparation and audit services at our hourly rates of between $195 – $395 per hour. We are also able offer fixed fees and success fees in special circumstances. Learn more at https://www.swansonreed.com/about-us/research-tax-credit-consulting/our-fees/


Choose your state


