May 2026: 2.07% (B+ grade)
 California inventionINDEX May 2026: 2.07% (B+ grade)
The inventionINDEX measures innovation output by comparing GDP growth with patent production growth.
Anything over C grade is positive sentiment; anything under C is negative outlook/sentiment. Using that sentiment, it is possible to observe trends over time, and also compare states/countries. In doing so, we can predict which states have the best chance to recover economically from the pandemic (or any other economic incident that may occur).
Historical California inventionINDEX Scores
The California inventionINDEX score for the past 12 months is shown in the table below.
| Month | inventionINDEX SCORE |
|---|---|
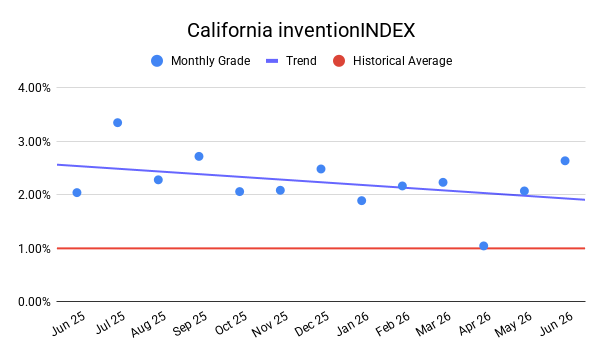
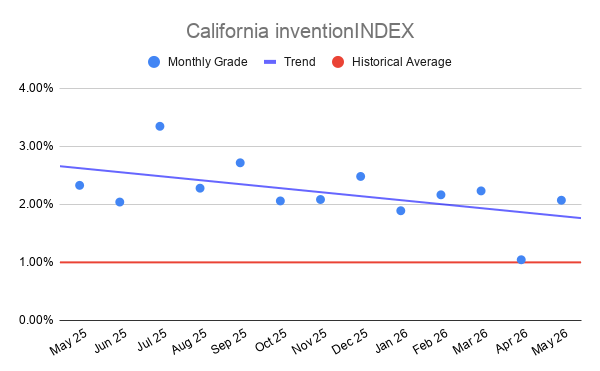
| May 2026 | 2.07% |
| April 2026 | 1.04% |
| March 2026 | 2.23% |
| February 2026 | 2.16% |
| January 2026 | 1.89% |
| December 2025 | 2.48% |
| November 2025 | 2.08% |
| October 2025 | 2.06% |
| September 2025 | 2.72% |
| August 2025 | 2.28% |
| July 2025 | 3.34% |
| June 2025 | 2.04% |
| May 2025 | 2.33% |
``The California inventionINDEX recorded a score of 2.07% with a B+ rating in May 2026, marking a significant and vital recovery from the immediate past. In April 2026, the index had plummeted to a historic low of 1.04%, receiving a C rating, which represented the weakest performance in the entire 60-month dataset. The swift rebound in May highlights a resilient baseline, aligning closely with typical mid-tier historical performances such as the 2.04% seen in June 2025 and the 2.02% from September 2022. While this recovery prevents a prolonged downturn, the current score remains below the stronger periods of early 2026 and late 2025, where scores consistently hovered above the 2.20% threshold.``
``An analysis of the broader historical trend reveals that the index frequently cycles through periods of intense expansion and moderate cooling. The absolute peak of the last 60 months occurred in October 2023, when the index reached an exceptional 4.05% with an A+ rating, followed closely by strong performances in August 2023 at 3.54% and July 2025 at 3.34%. Over the five-year span, an A or A+ rating is usually sustained when the index climbs above 2.50%, a benchmark achieved multiple times throughout 2024 and late 2025. Comparing the current 2.07% to these historical highs indicates that while the index has escaped its recent critical slump, it still possesses substantial ground to cover before matching the state’s peak periods of creative and technological output.``
``Securing a higher grade and index score yields numerous positive economic and structural outcomes for the regional ecosystem. High scores, particularly those in the A tier, signify a robust surge in patent filings, commercialized technologies, and entrepreneurial activity. This upward momentum acts as a powerful signal to venture capitalists and institutional investors, attracting capital that fuels further research and development. Additionally, an elevated grade fosters high-value job creation, enhances institutional prestige for local universities, and solidifies the region’s competitive edge in the global marketplace, ensuring long-term economic prosperity.``
``Conversely, a lower score and depressed grade carry severe negative implications for the innovation lifecycle. When the index drops significantly, as observed during the anomalous April 2026 contraction, it points to systemic bottlenecks such as reduced funding availability, regulatory hurdles, or a temporary stagnation in breakthrough discoveries. A sustained low score risks chilling investor confidence, causing capital flight to more dynamic markets and delaying critical product launches. Over time, these contractions can lead to a loss of specialized talent, diminished productivity, and a slower rate of economic adaptation, underscoring the necessity of maintaining a stable, supportive environment for industrial and scientific advancement.``
Discussion:
In May, the California inventionINDEX scored a positive sentiment which was lower than the previous year’s average but outperformed the downward trend for the year. This is similar to the prior 12 months, which experienced a slight downward trend.
As the economy continues to stabilize in the post-pandemic era, it remains uncertain whether any backlog of applications still exists or if the department has returned to normal processing timelines. The inventionINDEX could also be affected by lingering consequences from the pandemic, such as company closures, reduced workforces, and limited R&D capabilities, which may still be impacting current operations.
Learn More:
Are you thinking of patenting any of your bright ideas? Did you know your research work could be eligible for the R&D Tax Credit and you can receive up to 14% back on your expenses? To find out more, please check out our free online eligibility test.
Swanson Reed’s California office provides R&D tax credit consulting and advisory services to Pasadena, Los Angeles, San Diego, San Jose, San Francisco, Fresno, Sacramento, Long Beach, Oakland, Bakersfield, Anaheim, Santa Ana, Riverside, Stockton, Chula Vista, Irvine, Fremont, San Bernardino, Modesto, Oxnard and Fontana
Feel free to book a quick teleconference with one of R&D tax specialists if you would like to learn more about R&D tax credit opportunities.
Who We Are:
Swanson Reed is the largest Specialist R&D tax credit advisory firm in the United States. With offices nationwide, we are one of the only firms globally to exclusively provide R&D tax credit consulting services to our clients. We have been exclusively providing R&D tax credit claim preparation and audit compliance solutions for over 30 years.
Swanson Reed hosts daily free webinars and provides free IRS CE and CPE credits for CPAs. For more information please visit us at www.swansonreed.com/free-webinars or contact your usual Swanson Reed representative.