

CALIFORNIA INVENTIONINDEX | JANUARY 2026
January 2026: 1.89% (B grade)
California inventionINDEX January 2026: 1.89% (B grade)
The inventionINDEX measures innovation output by comparing GDP growth with patent production growth.
Anything over C grade is positive sentiment; anything under C is negative outlook/sentiment. Using that sentiment, it is possible to observe trends over time, and also compare states/countries. In doing so, we can predict which states have the best chance to recover economically from the pandemic (or any other economic incident that may occur).
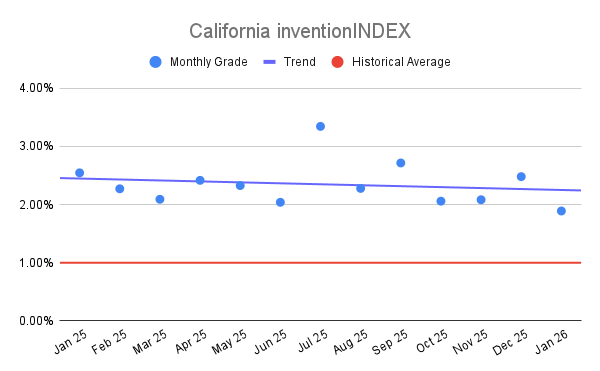
California inventionINDEX Scores – Last 12 months
| Month | inventionINDEX Score |
| January 2026 | 1.89% |
| Dec 25 | 2.48% |
| Nov 25 | 2.08% |
| Oct 25 | 2.06% |
| Sep 25 | 2.72% |
| Aug 25 | 2.28% |
| Jul 25 | 3.34% |
| Jun 25 | 2.04% |
| May 25 | 2.33% |
| Apr 25 | 2.42% |
| Mar 25 | 2.09% |
| Feb 25 | 2.27% |
| Jan 25 | 2.55% |
The inventionINDEX Score provides a vital barometer for California’s innovation ecosystem, reflecting the health of patent filings, venture capital flow, and R&D investment. Analyzing the data from January 2021 through January 2026 reveals a landscape of significant volatility, with the index fluctuating between a high of 4.05% in October 2023 and a low of 1.52% in June 2022. The most recent score of 1.89% in January 2026 marks a noticeable decline from the 2.48% (Rating A) seen in December 2025. This downward shift suggests a tightening of the creative economy as the state enters the new year, placing the current score below the five-year average of approximately 2.38%.
A higher grade, such as the A+ ratings frequently seen in 2023 and 2024, signals a robust period of intellectual property generation and investor confidence. When the index climbs above the 3.00% threshold, it typically correlates with a surge in “disruptive” technologies reaching the market and an influx of late-stage funding for startups. These peak periods foster a virtuous cycle where high-quality patents attract global talent, further cementing California’s status as a premier hub for technological advancement. For stakeholders, these scores represent a “green light” for aggressive expansion and long-term capital commitments.
Conversely, a lower score and rating, such as the recent B in January 2026 or the B- lows of 2022, carry sobering implications for the regional economy. A dip in the inventionINDEX often reflects external macroeconomic pressures, such as rising interest rates or decreased corporate R&D spending. When the score falls below 2.00%, it can indicate a stagnation in the pipeline of new ideas, potentially leading to a “brain drain” as innovators seek more supportive environments elsewhere. For the state, this contraction can result in reduced tax revenues from the tech sector and a slower pace of job creation in high-growth industries.
In comparing the current trajectory to the historical 60-month window, the data suggests that while California remains a powerhouse, it is currently navigating a period of consolidation. The transition from a 2.72% (A+) in September 2025 to the current 1.89% (B) highlights how quickly market sentiment and inventive output can shift. Historically, the index has shown an ability to rebound within three to four months following a dip, as evidenced by the recovery following the June 2022 low. Monitoring whether the February 2026 data stabilizes or continues this downward trend will be essential for determining if the state is entering a prolonged cooling period or a brief seasonal correction.
Discussion:
In January, the California inventionINDEX scored a positive sentiment which was lower than the previous year’s average and underperformed the upward trend for the year. This is in contrast to the prior 12 months, which experienced a slight downward trend.
As the economy continues to stabilize in the post-pandemic era, it remains uncertain whether any backlog of applications still exists or if the department has returned to normal processing timelines. The inventionINDEX could also be affected by lingering consequences from the pandemic, such as company closures, reduced workforces, and limited R&D capabilities, which may still be impacting current operations.
Learn More:
Are you thinking of patenting any of your bright ideas? Did you know your research work could be eligible for the R&D Tax Credit and you can receive up to 14% back on your expenses? To find out more, please check out our free online eligibility test.
Swanson Reed’s California office provides R&D tax credit consulting and advisory services to Pasadena, Los Angeles, San Diego, San Jose, San Francisco, Fresno, Sacramento, Long Beach, Oakland, Bakersfield, Anaheim, Santa Ana, Riverside, Stockton, Chula Vista, Irvine, Fremont, San Bernardino, Modesto, Oxnard and Fontana.
Feel free to book a quick teleconference with one of R&D tax specialists if you would like to learn more about R&D tax credit opportunities.
Who We Are:
Swanson Reed is the largest Specialist R&D tax credit advisory firm in the United States. With offices nationwide, we are one of the only firms globally to exclusively provide R&D tax credit consulting services to our clients. We have been exclusively providing R&D tax credit claim preparation and audit compliance solutions for over 30 years.
Swanson Reed hosts daily free webinars and provides free IRS CE and CPE credits for CPAs. For more information please visit us at www.swansonreed.com/free-webinars or contact your usual Swanson Reed representative.
Are you eligible?

Why choose us?

Pass an Audit?

What is the R&D Tax Credit?
The Research & Experimentation Tax Credit (or R&D Tax Credit), is a general business tax credit under Internal Revenue Code section 41 for companies that incur research and development (R&D) costs in the United States. The credits are a tax incentive for performing qualified research in the United States, resulting in a credit to a tax return. For the first three years of R&D claims, 6% of the total qualified research expenses (QRE) form the gross credit. In the 4th year of claims and beyond, a base amount is calculated, and an adjusted expense line is multiplied times 14%. Click here to learn more.
Never miss a deadline again

Stay up to date on IRS processes

Discover R&D in your industry

R&D Tax Credit Preparation Services
Swanson Reed is one of the only companies in the United States to exclusively focus on R&D tax credit preparation. Swanson Reed provides state and federal R&D tax credit preparation and audit services to all 50 states.
If you have any questions or need further assistance, please call or email our CEO, Damian Smyth on (800) 986-4725.
Feel free to book a quick teleconference with one of our national R&D tax credit specialists at a time that is convenient for you.
R&D Tax Credit Audit Advisory Services
creditARMOR is a sophisticated R&D tax credit insurance and AI-driven risk management platform. It mitigates audit exposure by covering defense expenses, including CPA, tax attorney, and specialist consultant fees—delivering robust, compliant support for R&D credit claims. Click here for more information about R&D tax credit management and implementation.
Our Fees
Swanson Reed offers R&D tax credit preparation and audit services at our hourly rates of between $195 – $395 per hour. We are also able offer fixed fees and success fees in special circumstances. Learn more at https://www.swansonreed.com/about-us/research-tax-credit-consulting/our-fees/


Choose your state


